This week we will be taking a look at the fundamentals of the Cognos Mashup Service. We’ll break it down into its component parts in order to see how it brings value to the mix of IBM Cognos offerings.
In order to utilize the Cognos Mashup Service one needs to meet the following minimum requirements:
1. IBM Cognos BI Server 8.4.1
2. A client capable of interacting with SOAP or URL based services over HTTP
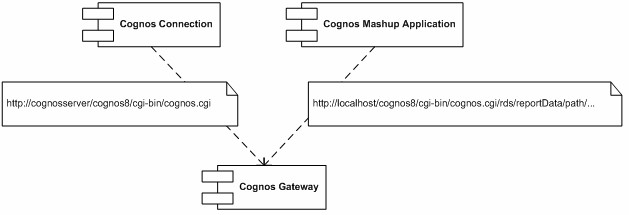
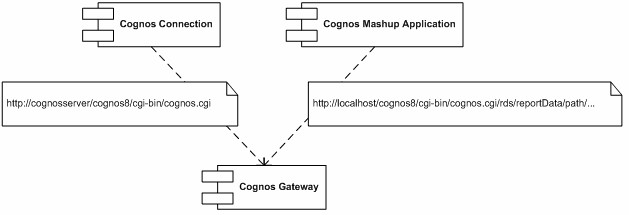
Cognos Connection and the Cognos Mashup Service can be accessed via the Cognos gateway
Authors Note: Use the voice of actor R. Lee Ermey (Gunny from Full Metal Jacket)
For the next few articles I will be your instructor. You may call me “Drill Sergeant”. I will be breaking you recruits down into the lowly grains of sand came from and building you back up into laser etched pieces of silicon. You will leave here with the tools that you need to survive in the battlefield known as the Cognos Mashup Service. You will be able to code your way through hazardous custom visualization terrain. You will be able to distinguish friend from foe when it comes to design notions. You may have thought that you would be coddled by the promise of easy REST services. But this is not your mama’s REST. Can I get a “YES DRILL SERGEANT!”? Now drop and give me twenty!
Ok, let me take a break from character to give it to you straight. This week we will be taking a look at the fundamentals of the Cognos Mashup Service. We’ll break it down into its component parts in order to see how it brings value to the mix of IBM Cognos offerings.
In order to utilize the Cognos Mashup Service one needs to meet the following minimum requirements:
1. IBM Cognos BI Server 8.4.1
2. A client capable of interacting with SOAP or URL based services over HTTP
Cognos Connection and the Cognos Mashup Service can be accessed via the Cognos gateway

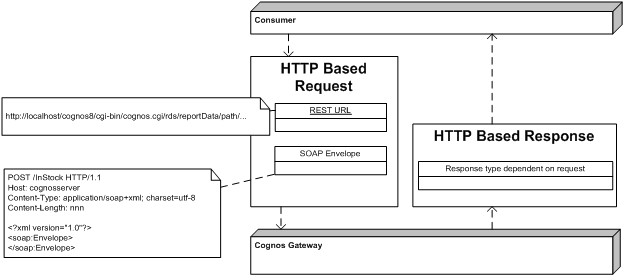
The Cognos Mashup Service is made up of two distinct parts that work in tandem to allow consumers to break report data outside of the report viewer and into custom visualizations. One part of the service is the transport interface and the other is the payload. In the diagram below we can consider the request as the transport and the responsee as the payload.

The transport interface is the means by which we can invoke reports. There are two options for consumers to use. One is SOAP based and the other utilizes REST style URLs. Both interfaces run over HTTP and are similar in structure. That is, for each logical operation in the SOAP style interface there is a matching one in the REST style. The exact method specifications observe the idiosyncrasies for the chosen invocation style. But the bottom line is…the ability to logon, invoke a report, get the output, and log off is available to both camps.
So you might ask yourself “self, why would I choose one over the other?” Often the answer to this presents itself when looking at project technology or conventions. Take the example of a consumer that is developed entirely on the client side. It uses HTML and JavaScript to interact with the Cognos Mashup Service. In a vacuum the REST URL based interface would make for an easier integration. In contrast, another project might have existing Cognos SDK assets in a Java servlet. They are accustomed to the SOAP stubs exposed by the SDK. It feels more natural for this situation to lean towards being a SOAP based consumer of mashup services. In practice this has not really been a difficult choice to weigh out. When looking at the two choices one always seems to fit better when considering the overall solution. Attempts to use the other feel forced.
The logical operations offered up by the transport interface allow a consumer to perform tasks centered on running Cognos reports and analyses. The set of options allows a consumer to march through the full lifecycle of running a report. This includes:
• Authentication
• Parameter assignment
• Report Execution (synchronous and asynchronous)
• Drill behavior
• Output Retrieval
The mashup service even offers some goodies that are not available through the SDK. However, we’ll save that discussion for an upcoming article comparing and contrasting the Mashup Service against the SDK.
Now we have a means of invoking reports through an HTTP based set of services. What comes out the other end? That leads us into the second component of the mashup service. Enter…”The Payload”.
One of the options that we can specify when invoking a report through the mashup service is the output format. There are a number of available options including HTML Layout Data XML (LDX), and JSON. There are a few others but this covers the spectrum in a broad sense. HTML is pretty much what you would expect. They look very similar to what one would obtain from a report viewed through the report viewer inside Cognos Connection. The more promising formats are LDX and JSON. In fact if there is a clear smash hit by the Cognos Mashup Service it is the introduction of these two formats.
Both of these formats yield the report output in a presentation neutral format. This allows the consumer of the report output to render the information in any visualization that can understand JSON or XML. Take a moment to read that again.
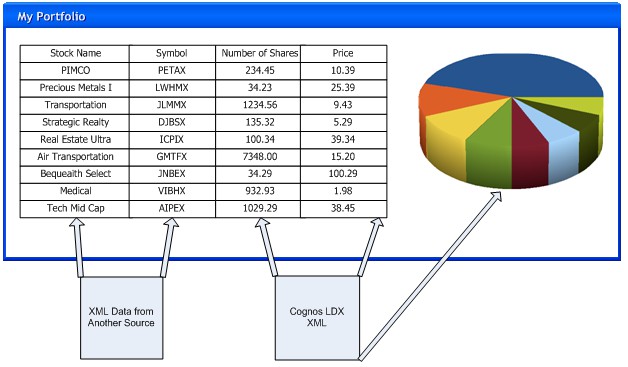
The report data is now freed of the shackles placed on it by the Cognos Viewer. Data can now roam into places that were previously impractical. For example, Rich Internet Applications can use frameworks like the Google Visualization API or Ext-JS to spice up the presentation of the data. Mobile integration becomes much more attainable as the output can be adapted to these devices. Cognos data can be truly mashed up with data from outside sources. In fact, data from Cognos BI was recently seen, in the wild, cavorting with data from a popular content management system in the same Ext-JS grid no less! Scandalous! What does this mean? In this case, it allowed both sets of data to be managed through their native tools without a complex contrived process to unite them on the browser.
Below is a simple low fidelity mock up illustrating heterogeneous data sources sharing the same page.

This flexibility comes with some tradeoffs. Since we are deferring the rendering of the data to another part of the application we are essentially transferring some of the development that is traditionally done by the report author to a person that is an expert in the visualization technology. The effort to weave the report data into the visualization will vary compared to authoring a pixel perfect report in the traditional Cognos studios. Project planners need to understand the effect that this has on development timelines. One will find that estimates are more accurate when this new division of labor is embraced.
To sum up for this piece, the Cognos Mashup Service is an exciting addition to the arsenal of tools available to the mix. It allows BI data to go beyond just stamping an <iframe>, containing a report viewer, into an HTML page. Yet, time has taught us that nothing is for free. Flexibility of presenting data comes at the expense of bringing new skill sets to the solution set. Let this information soak for a while. In the subsequent entries in this series we’ll get into greater detail regarding the use of mashup as well as how it stacks up against other solution candidates.


