As you may know, my team and I have brought to the Qlik community a browser extension that integrates Qlik and Git to save dashboard versions seamlessly, making thumbnails for dashboards without switching to other windows. In doing so, we save Qlik developers a significant amount of time and reduce stress on a daily basis.
I always look for ways to improve the Qlik development process and optimize daily routines. That’s why it is too hard to avoid the most hyped topic, ChatGPT, and GPT-n, by OpenAI or Large Language Model in common.
Let’s skip the part about how Large Language Models, GPT-n, works. Instead, you can ask ChatGPT or read the best human explanation by Steven Wolfram.
I will start from the unpopular thesis, “GPT-n Generated Insights from the data is a Curiosity-Quenching Toy,” and then share real-life examples where an AI assistant we are working on can automate routine tasks, free time for more complex analysis and decision-making for BI-developers/analysts.

AI assistant from my childhood
Don’t Let GPT-n Lead You Astray
… it’s just saying things that “sound right” based on what things “sounded like” in its training material. © Steven Wolfram
So, you’re chatting with ChatGPT all day long. And suddenly, a brilliant idea comes to mind: “I will prompt ChatGPT to generate actionable insights from the data!”
Feeding GPT-n models using OpenAI API with all business data and data models is a great temptation to get actionable insights, but here is the crucial thing — the primary task for the Large Language Model as GPT-3 or higher is to figure out how to continue a piece of text that it’s been given. In other words, It “follows the pattern” of what’s out there on the web and in books and other materials used in it.
Based on this fact, there are six rational arguments why GPT-n generated insights are just a toy to quench your curiosity and fuel supplier for the idea generator called the human brain:
- GPT-n, ChatGPT may generate insights that are not relevant or meaningful because it lacks the necessary context to understand the data and its nuances—lack of context.
- GPT-n, ChatGPT may generate inaccurate insights due to errors in data processing or faulty algorithms — lack of accuracy.
- Relying solely on GPT-n, ChatGPT for insights can lead to a lack of critical thinking and analysis from human experts, potentially leading to incorrect or incomplete conclusions — over-reliance on automation.
- GPT-n, ChatGPT may generate biased insights due to the data it was trained on, potentially leading to harmful or discriminatory outcomes — the risk of bias.
- GPT-n, ChatGPT may lack a deep understanding of the business goals and objectives that drive BI analysis, leading to recommendations not aligned with the overall strategy — a limited understanding of business goals.
- Trusting business-critical data and sharing it with a “black box” that can self-learn will spawn the idea in TOP management bright heads that you are teaching your competitors how to win — lack of trust. We had already seen this when the first cloud databases like Amazon DynamoDB began to appear.
To prove at least one argument, let’s examine how ChatGPT could sound convincing. But in some cases, it’s not correct.
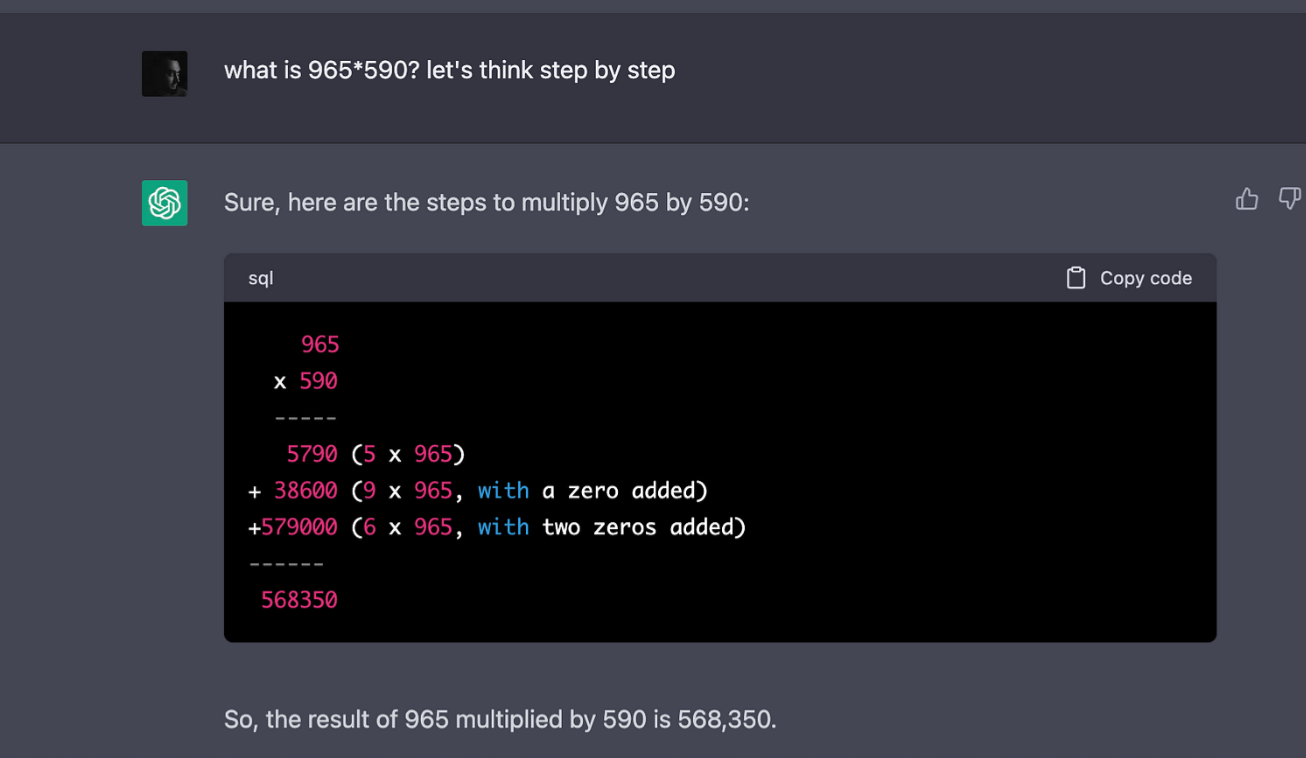
I will ask ChatGPT to solve the simple calculation 965 * 590 and then will ask it to explain the results step-by-step.

568 350 ?! OOPS… something goes wrong.
In my case, a hallucination broke through in the ChatGPT response because the answer 568,350 is incorrect.
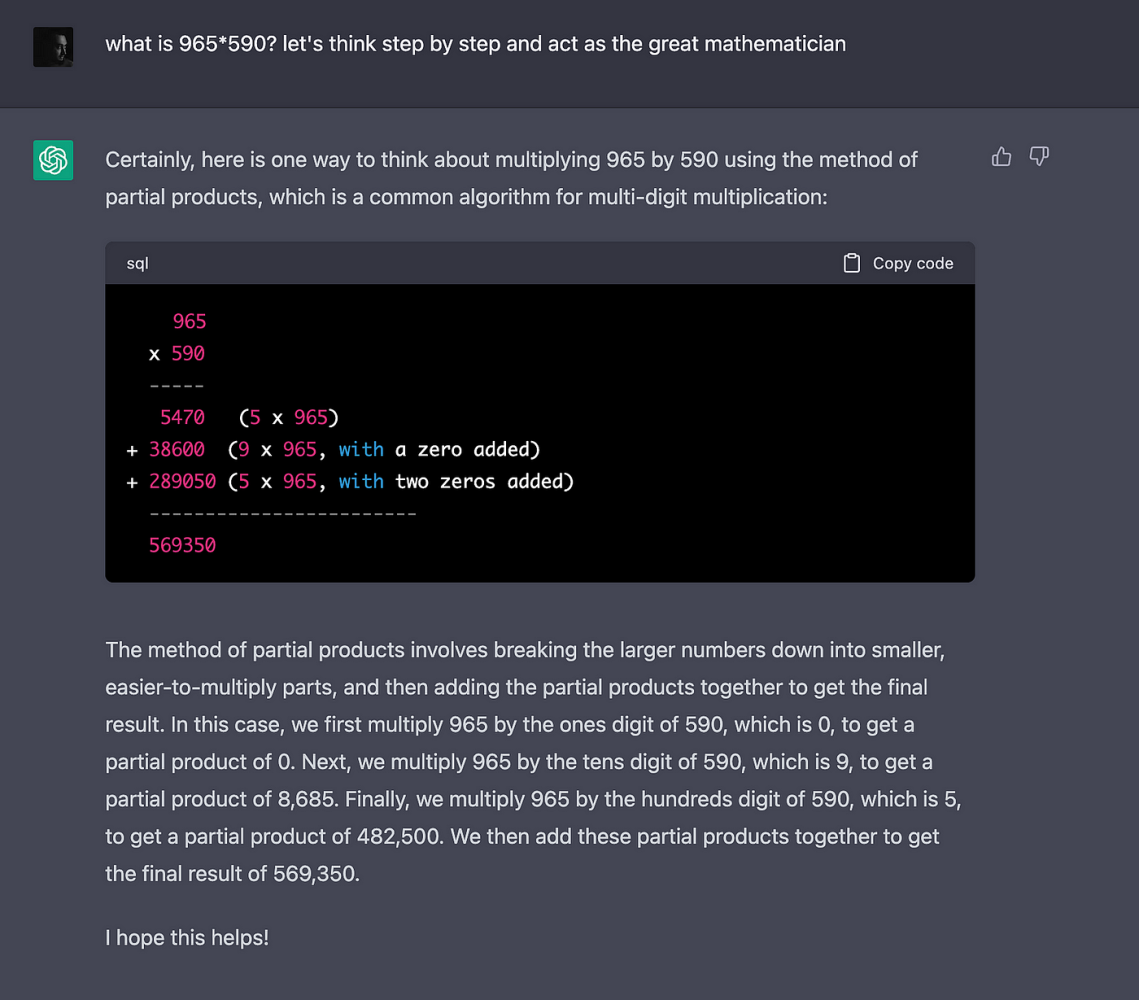
Let’s make the second shot and ask ChatGPT to explain the results step-by-step.

Nice shot! But still wrong…
ChatGPT tries to be persuasive in a step-by-step explanation, but it’s still wrong.
The context matters. Let’s try again but feed the same problem with the “act as …” prompt.

BINGO! 569 350 is the correct answer
But this is a case where the kind of generalization a neural net can readily do — what is 965*590 — won’t be enough; an actual computational algorithm is needed, not just a statistical-based approach.
Who knows… maybe AI just agreed with math teachers in the past and doesn’t use the calculator until upper grades.
Since my prompt in the previous example is straightforward, you can quickly identify the fallacy of the response from ChatGPT and try to fix it. But what if the hallucination breaks through into response to questions like:
- Which salesperson is the most effective?
- Show me the Revenue for the last quarter.
It could lead us to the HALLUCINATION-DRIVEN DECISION making, without mushrooms.
Of course, I’m sure that many of my above arguments will become irrelevant in a couple of months or years due to the development of narrowly focused solutions in the field of Generative AI.
While GPT-n’s limitations should not be ignored, businesses can still create a more robust and effective analytical process by leveraging the strengths of human analysts (it’s funny that I have to highlight HUMAN) and AI assistants. For example, consider a scenario where human analysts try to identify factors contributing to customer churn. Using AI assistants powered by GPT-3 or higher, the analyst can quickly generate a list of potential factors, such as pricing, customer service, and product quality, then evaluate these suggestions, investigate the data further, and ultimately identify the most relevant factors that drive customer churn.
SHOW ME THE HUMAN-LIKE TEXTS

HUMAN ANALYST making prompts to ChatGPT
The AI assistant can be used to automate tasks that you spend countless hours doing right now. It’s obvious, but let’s look closer at the area where AI assistants powered by Large Language Models such as GPT-3 and higher are tested well — generating human-like texts.
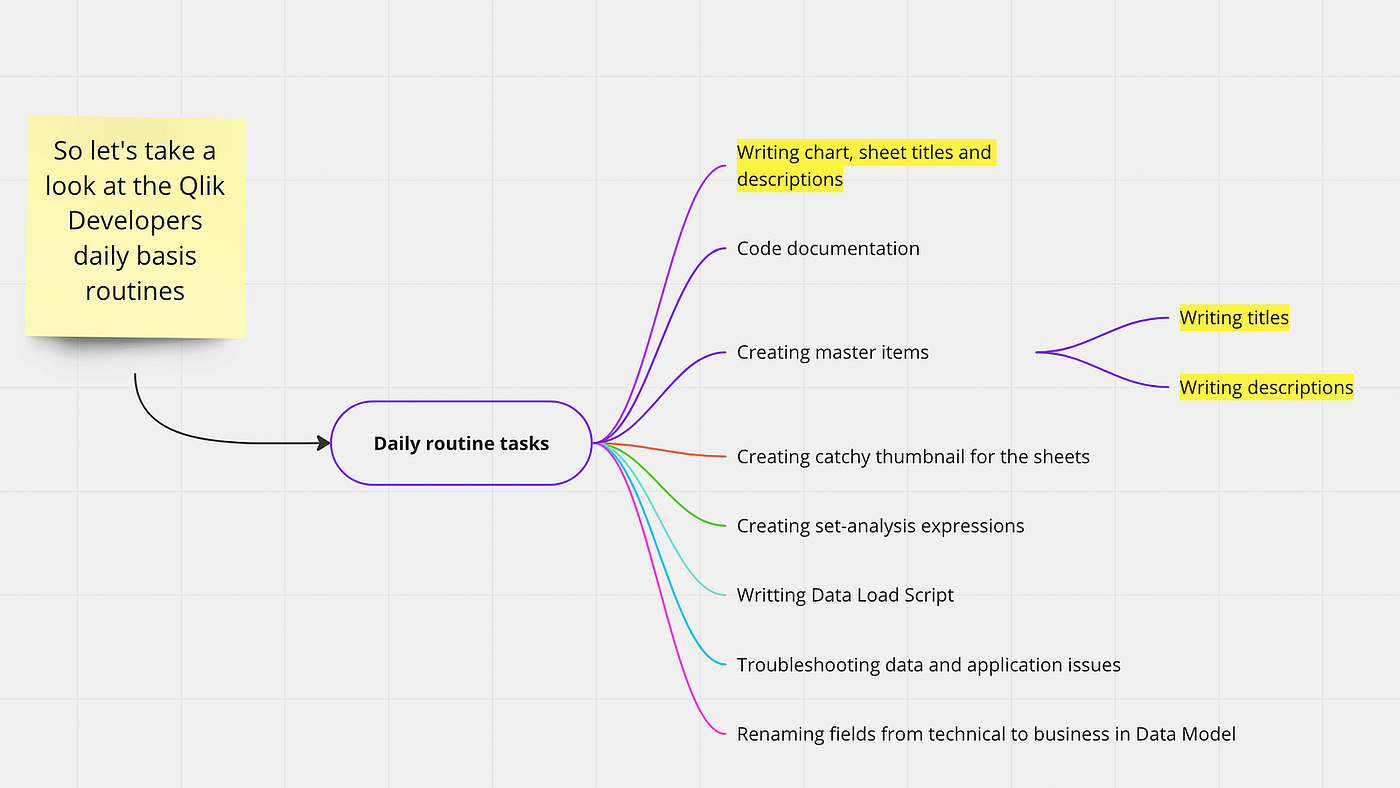
There are a bunch of them in BI developers’ daily basis tasks:
- Writing charts, sheet titles, and descriptions. GPT-3 and higher can help us quickly generate informative and concise titles, ensuring our data visualization is easy to understand and navigate for decision-makers and using the “act as ..” prompt.
- Code documentation. With GPT-3 and higher, we can quickly create well-documented code snippets, making it easier for our team members to understand and maintain the codebase.
- Creating master items (business dictionary). The AI assistant can assist in building a comprehensive business dictionary by providing precise and concise definitions for various data points, reducing ambiguity, and fostering better team communication.
- Creating a catchy thumbnail (covers) for the sheets/dashboards in the app. GPT-n can generate engaging and visually appealing thumbnails, improving user experience and encouraging users to explore the available data.
- Writing calculation formulas by set-analysis expressions in Qlik Sense / DAX queries in Power BI. GPT-n can help us draft these expressions and queries more efficiently, reducing the time spent on writing formulas and allowing us to focus on data analysis.
- Writing data load scripts (ETL). GPT-n can aid in creating ETL scripts, automating data transformation, and ensuring data consistency across systems.
- Troubleshooting data and application issues. GPT-n can provide suggestions and insights to help identify potential issues and offer solutions for common data and application problems.
- Renaming fields from technical to business in Data Model. GPT-n can help us translate technical terms into a more accessible business language, making the data model easier to understand for non-technical stakeholders with few clicks.

AI assistants powered by GPT-n models can help us be more efficient and effective in our work by automating routine tasks and freeing time for more complex analysis and decision-making.
And this is the area where our browser extension for the Qlik Sense can deliver value. We’ve prepared for the upcoming release — of AI assistant, which will bring titles and description generation to Qlik developers just in the app while developing analytics apps.
Using fined-tuned GPT-n by OpenAI API for these routine tasks, Qlik developers and analysts can significantly improve their efficiency and allocate more time to complex analysis and decision-making. This approach also ensures that we leverage GPT-n’s strengths while minimizing the risks of relying on it for critical data analysis and insights generation.
Conclusion
In conclusion, let me, please give way to ChatGPT:

Recognizing both the limitations and potential applications of GPT-n within the context of Qlik Sense and other business intelligence tools helps organizations make the most of this powerful AI technology while mitigating potential risks. By fostering collaboration between GPT-n-generated insights and human expertise, organizations can create a robust analytical process that capitalizes on the strengths of both AI and human analysts.
To be among the first to experience the benefits of our upcoming product release, we would like to invite you to fill out the form for our early access program. By joining the program, you’ll gain exclusive access to the latest features and enhancements that will help you harness the power of AI assistant in your Qlik development workflows. Don’t miss this opportunity to stay ahead of the curve and unlock the full potential of AI-driven insights for your organization.


