Post: How to Prevent Broken Shortcuts in Cognos Using MotioPI Pro

Creating shortcuts in Cognos is a convenient way to access the information you use frequently. Shortcuts point to Cognos objects such as reports, report views, jobs, folders, and so on. However, when you move objects to new folders/locations within Cognos, the shortcuts that reference them turn into broken links. You would then have to go into Cognos and recreate all of the shortcuts to those objects that were moved.

Or, you could conveniently move the Cognos objects within MotioPI Pro in order to prevent broken shortcuts and avoid the pain of having to recreate them. MotioPI Pro performs many different types of actions to Cognos objects in bulk. One example of PI Pro’s bulk action capabilities is the “Move” action feature. The Move action allows you to automatically update shortcuts when you move Cognos objects.

This blog will provide you with the steps on how to move Cognos content using MotioPI Pro and how their shortcuts are updated.

1. In MotioPI Pro click to open the Content panel on the left.
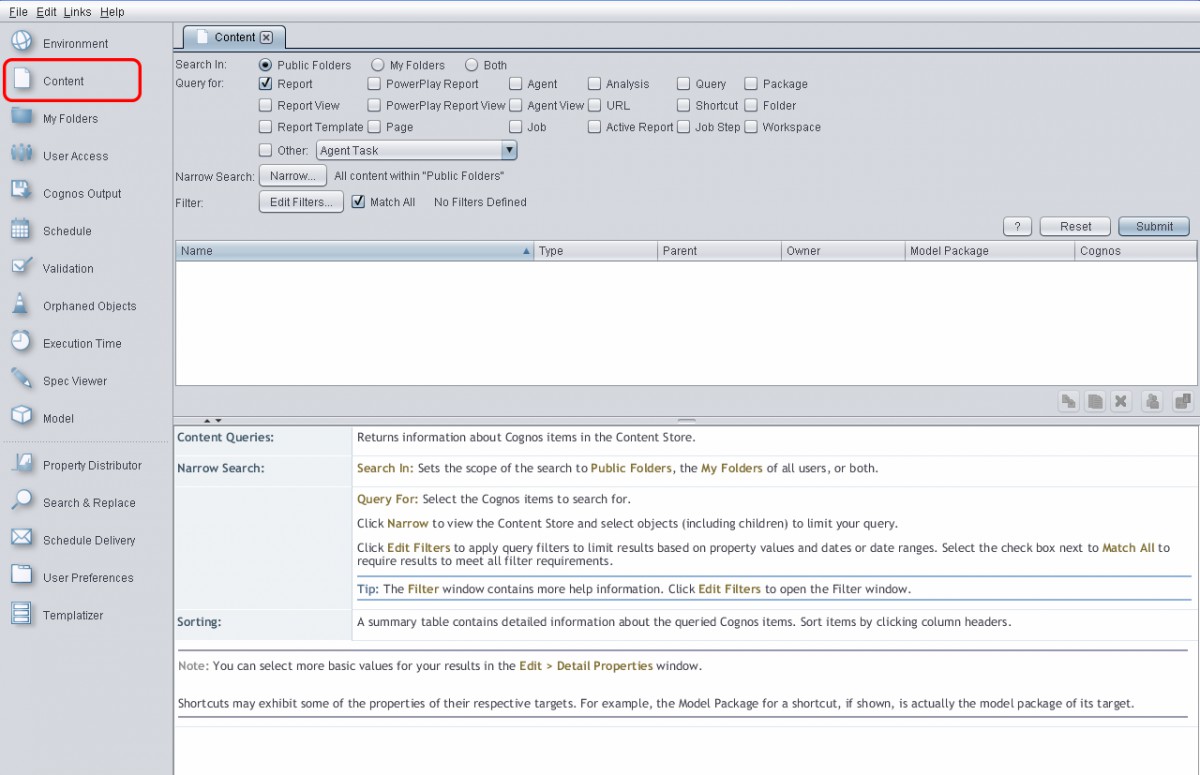
Click to enlarge

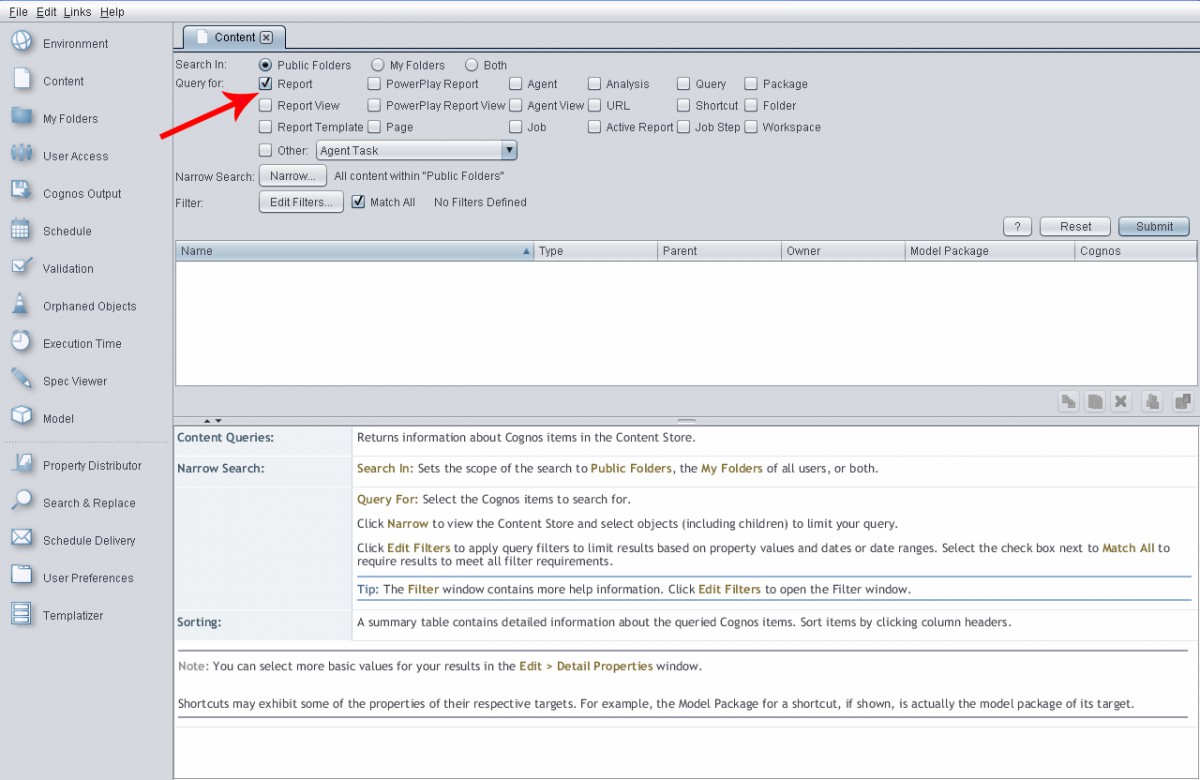
2. By default, Report is always selected as the object type but you can refine this to whatever object type you would like to move. In this example, we will leave Report selected since we are going to move some reports.

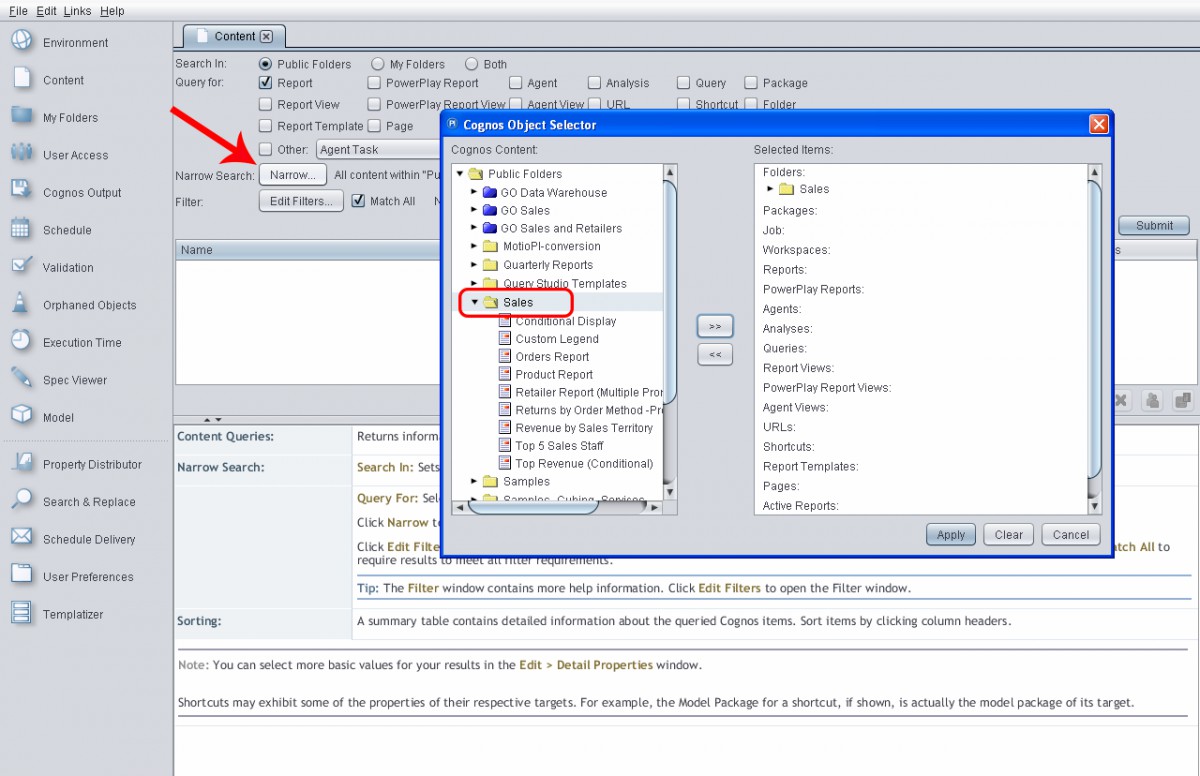
3. Click the Narrow button to open the Cognos Object Selector which will allow you to choose the desired folder containing your reports. (“Sales” in our example).

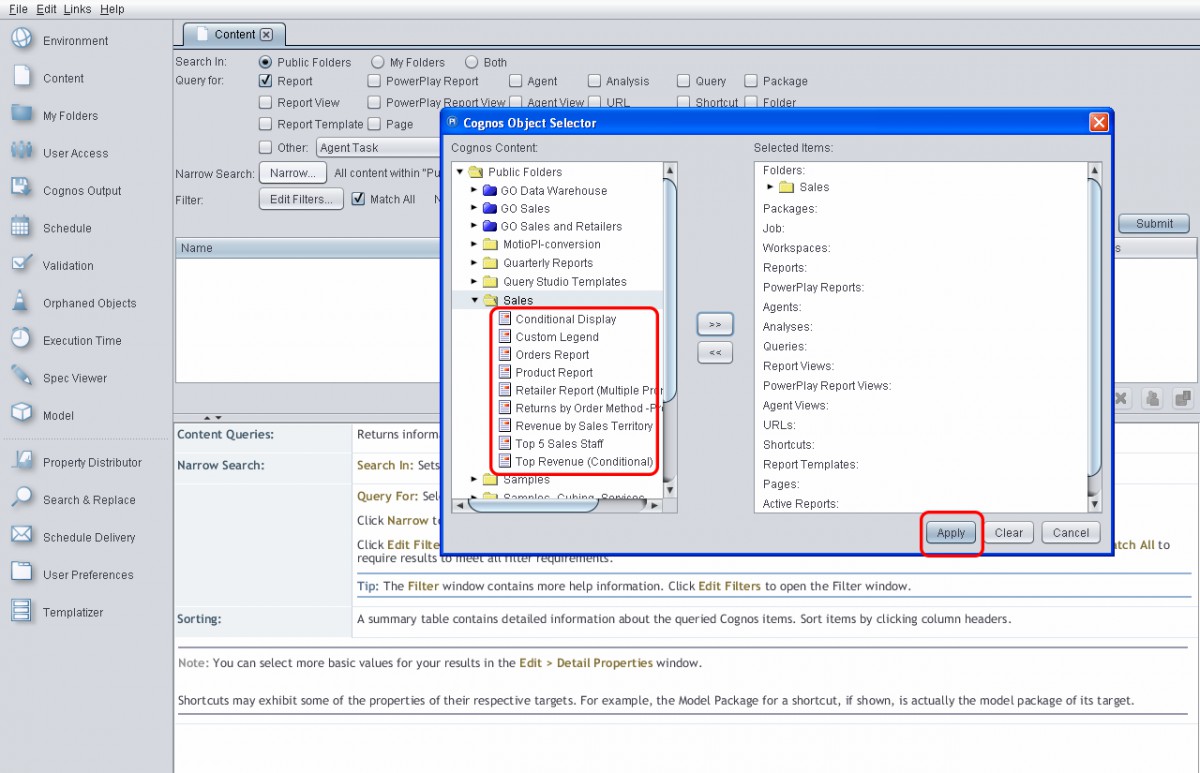
4. Click the Apply button and all of the reports in the sales folder will be returned. In this example, we will move all of the reports from the Sales folder, but you could narrow it down to only move specific objects as needed.

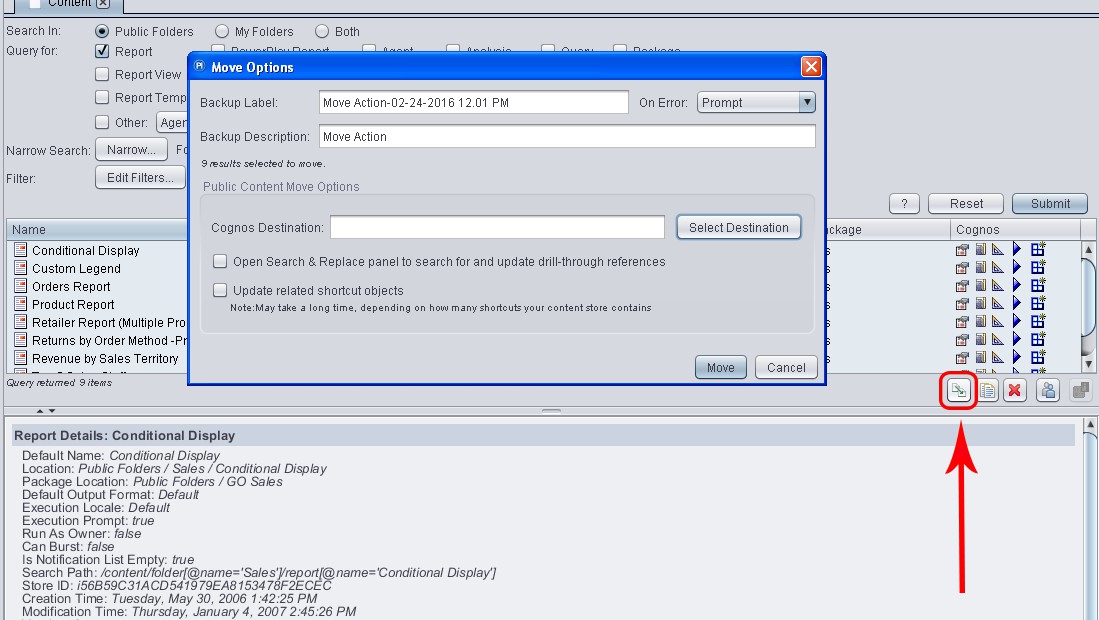
5. From the available actions icons, select the Move Action to open the Move Options dialog.

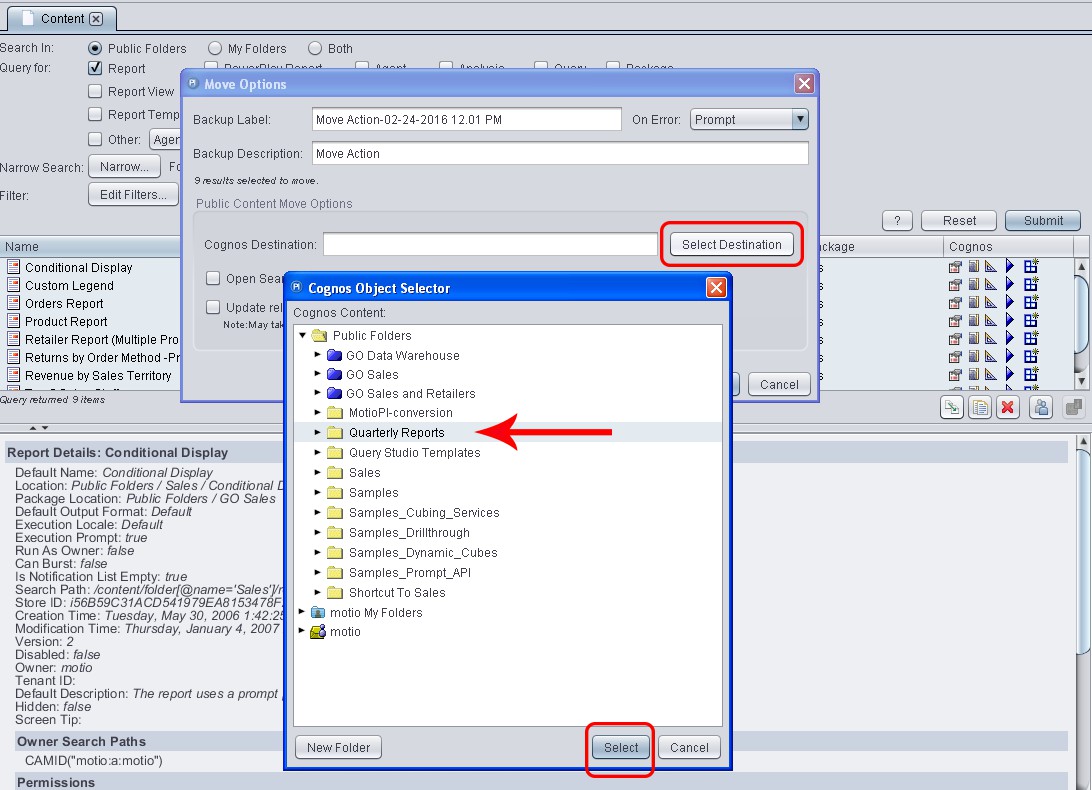
6. In the Move Options dialog, click the Select Destination button. This will open the Cognos Object Selector dialog for you to choose your target location. We’ll choose “Quarterly Reports” in this example and then click the Select button.

7. Next, we will select the check box next to “Update related shortcut objects” in the Move Options dialog, to automatically update all of the shortcuts that reference our selected reports.

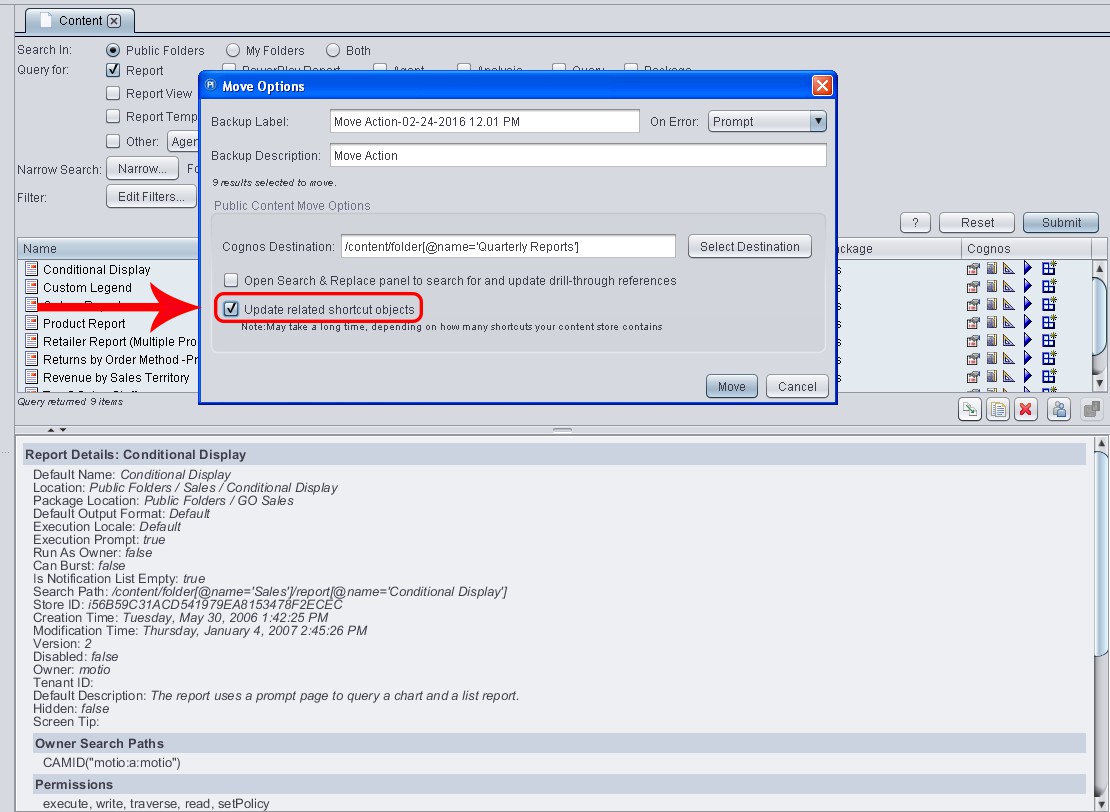
8. Click the Move button to move the objects to their new location.

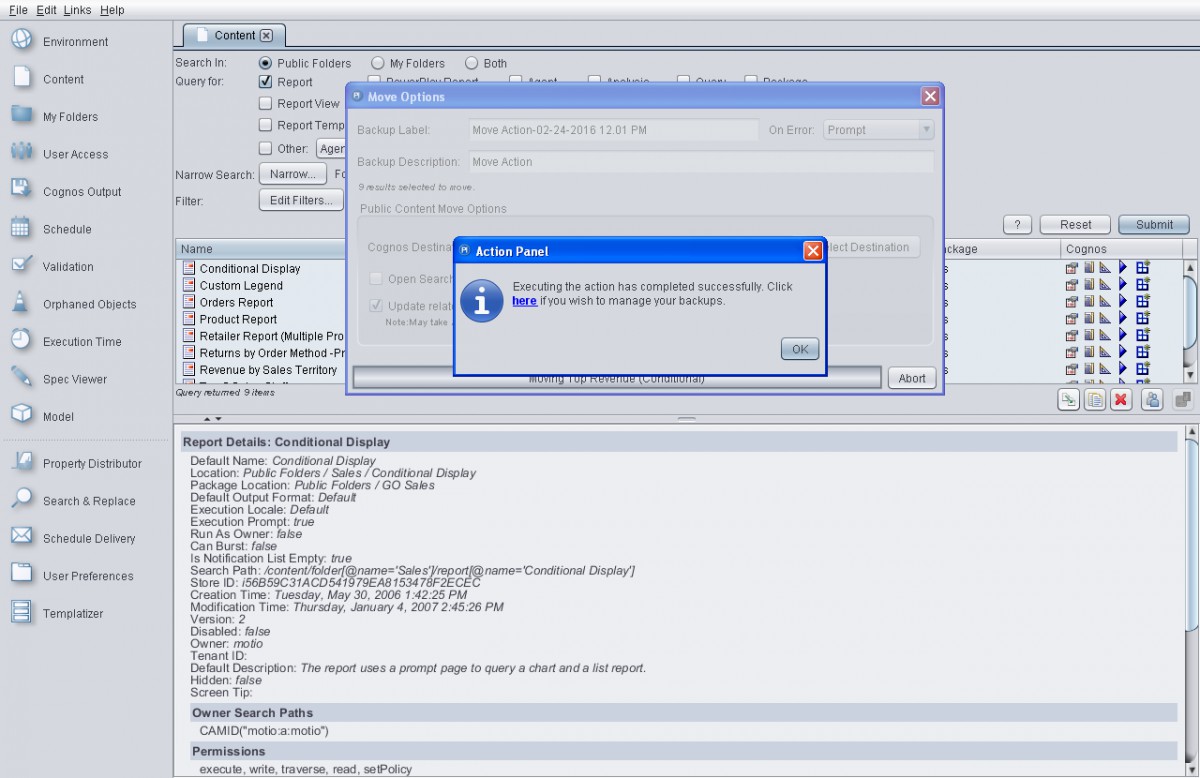
9. Lastly, you will receive a confirmation dialog indicating that your Cognos reports and their shortcuts have been successfully moved.

You can purchase MotioPI Pro from our website!

Scroll to Top
As the BI space evolves, organizations must take into account the bottom line of amassing analytics assets.
The more assets you have, the greater the cost to your business. There are the hard costs of keeping redundant assets, i.e., cloud or server capacity. Accumulating multiple versions of the same visualization not only takes up space, but BI vendors are moving to capacity pricing. Companies now pay more if you have more dashboards, apps, and reports. Earlier, we spoke about dependencies. Keeping redundant assets increases the number of dependencies and therefore the complexity. This comes with a price tag.
The implications of asset failures differ, and the business’s repercussions can be minimal or drastic.
Different industries have distinct regulatory requirements to meet. The impact may be minimal if a report for an end-of-year close has a mislabeled column that the sales or marketing department uses, On the other hand, if a healthcare or financial report does not meet the needs of a HIPPA or SOX compliance report, the company and its C-level suite may face severe penalties and reputational damage. Another example is a report that is shared externally. During an update of the report specs, the low-level security was incorrectly applied, which caused people to have access to personal information.
The complexity of assets influences their likelihood of encountering issues.
The last thing a business wants is for a report or app to fail at a crucial moment. If you know the report is complex and has a lot of dependencies, then the probability of failure caused by IT changes is high. That means a change request should be taken into account. Dependency graphs become important. If it is a straightforward sales report that tells notes by salesperson by account, any changes made do not have the same impact on the report, even if it fails. BI operations should treat these reports differently during change.
Not all reports and dashboards fail the same; some reports may lag, definitions might change, or data accuracy and relevance could wane. Understanding these variations aids in better risk anticipation.

Marketing uses several reports for its campaigns – standard analytic assets often delivered through marketing tools. Finance has very complex reports converted from Excel to BI tools while incorporating different consolidation rules. The marketing reports have a different failure mode than the financial reports. They, therefore, need to be managed differently.

It’s time for the company’s monthly business review. The marketing department proceeds to report on leads acquired per salesperson. Unfortunately, half the team has left the organization, and the data fails to load accurately. While this is an inconvenience for the marketing group, it isn’t detrimental to the business. However, a failure in financial reporting for a human resource consulting firm with 1000s contractors that contains critical and complex calculations about sickness, fees, hours, etc, has major implications and needs to be managed differently.

Acknowledging that assets transition through distinct phases allows for effective management decisions at each stage. As new visualizations are released, the information leads to broad use and adoption.
Think back to the start of the pandemic. COVID dashboards were quickly put together and released to the business, showing pertinent information: how the virus spreads, demographics affected the business and risks, etc. At the time, it was relevant and served its purpose. As we moved past the pandemic, COVID-specific information became obsolete, and reporting is integrated into regular HR reporting.
Reports and dashboards are crafted to deliver valuable insights for stakeholders. Over time, though, the worth of assets changes.
When a company opens its first store in a certain area, there are many elements it needs to understand – other stores in the area, traffic patterns, pricing of products, what products to sell, etc. Once the store is operational for some time, specifics are not as important, and it can adopt the standard reporting. The tailor-made analytic assets become irrelevant and no longer add value to the store manager.