Post: Locate Cognos Schedule Recipients

This blog entry will demonstrate how to use the MotioPI schedule panel to quickly find all schedules which deliver Cognos outputs to a particular recipient.

The PI schedule panel lets you query for all scheduled report executions in a given Cognos instance. The results allow you to peruse various bits of information on each schedule, such as the recipient emails (or user names), start date, end date, frequency, owner, etc.

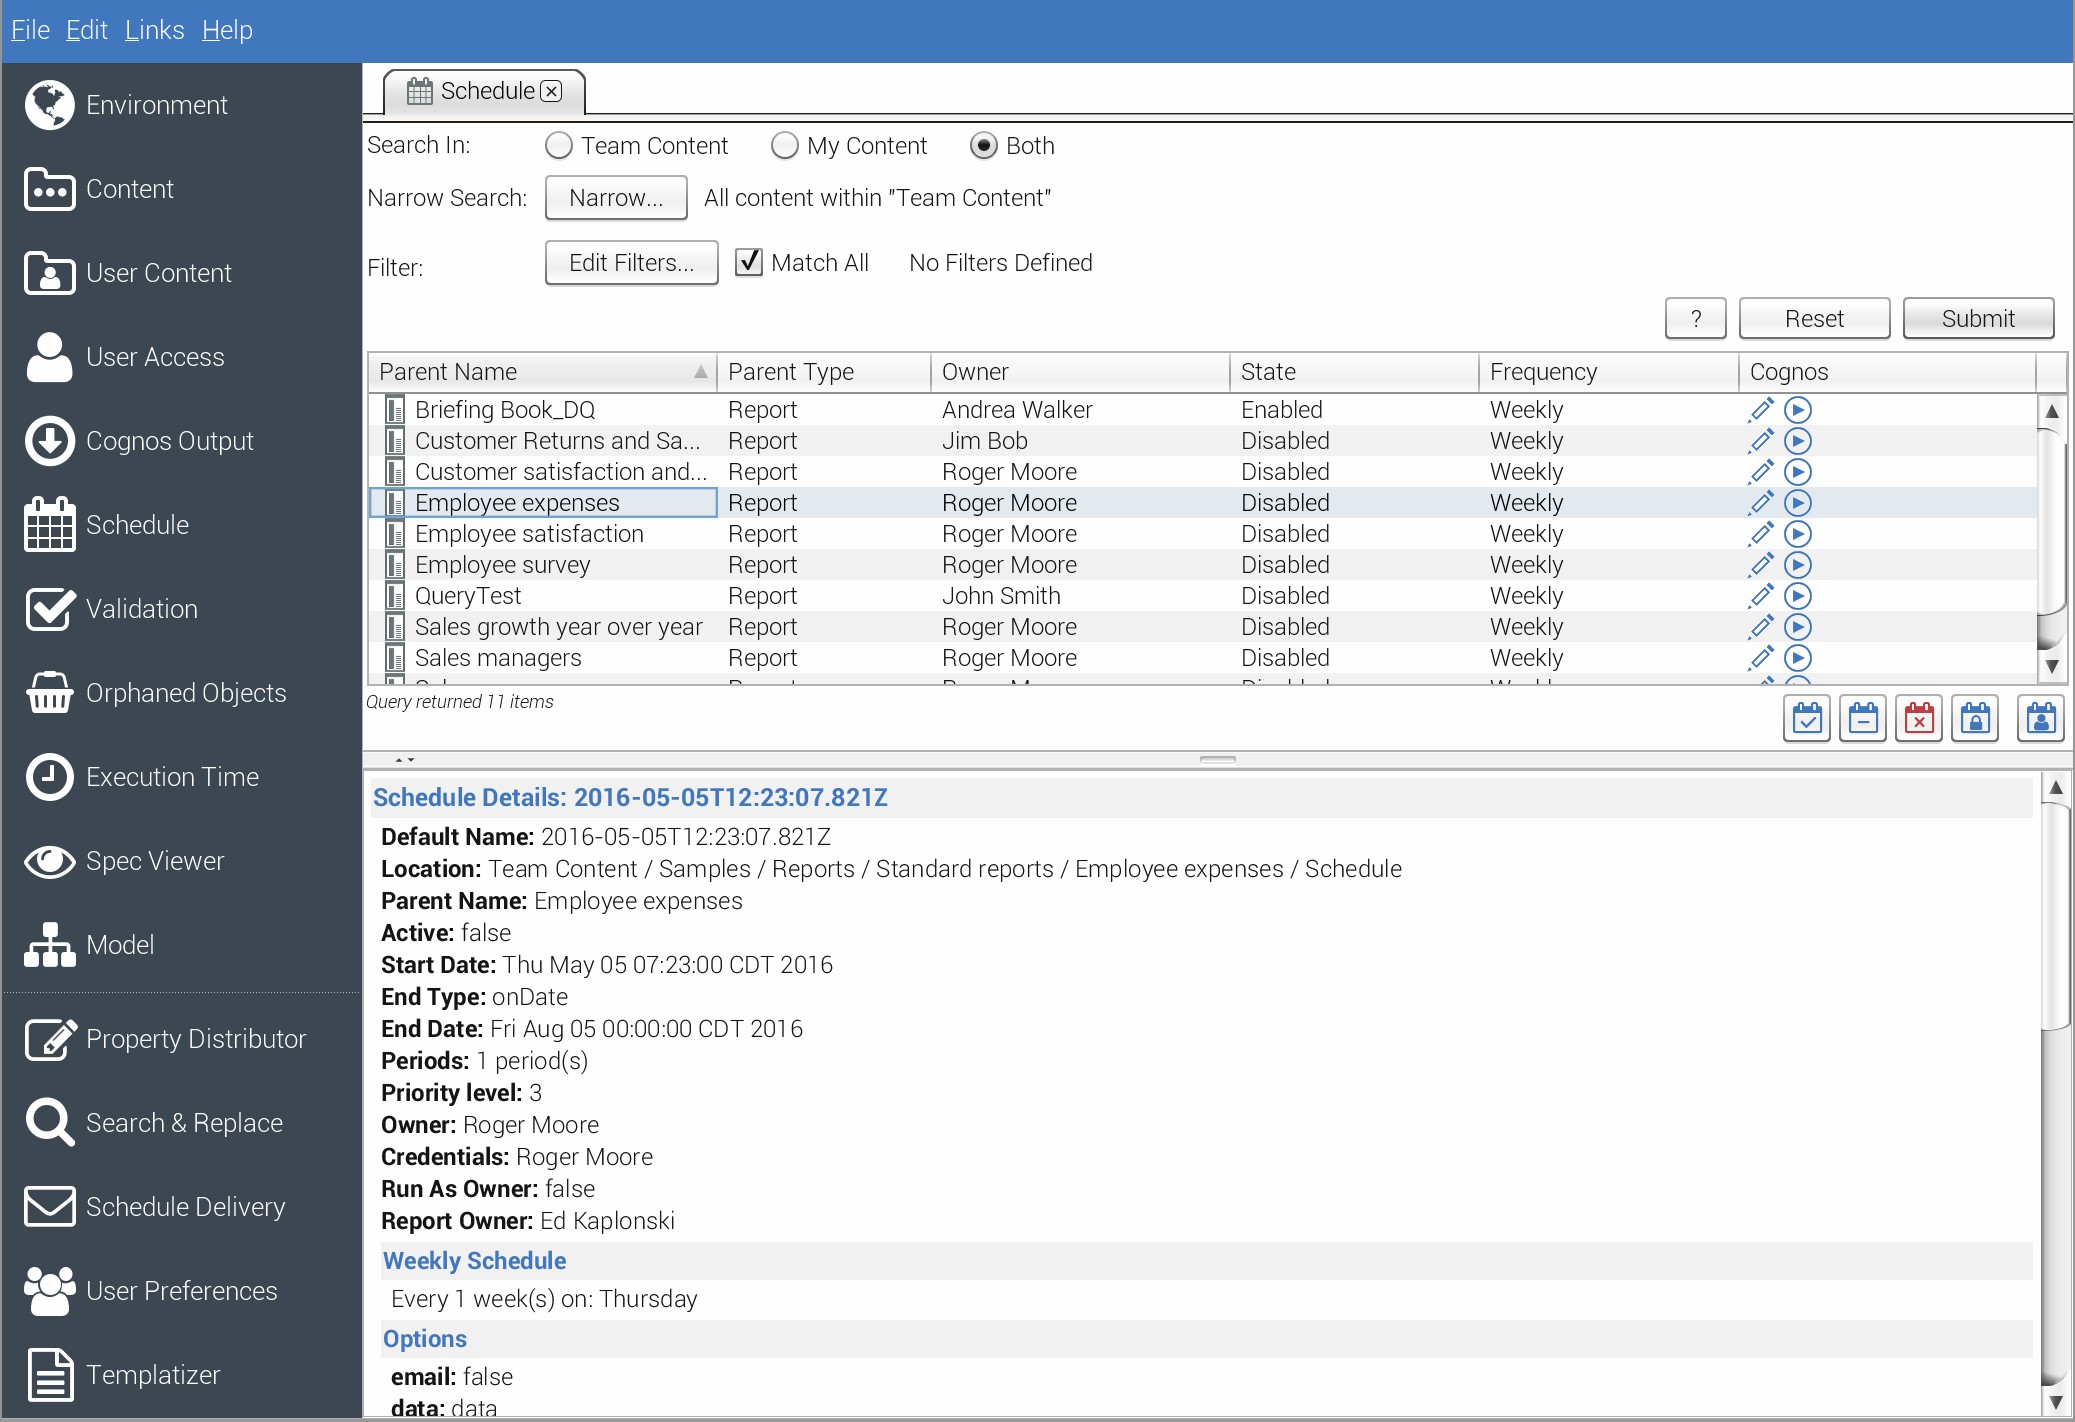
To begin, launch MotioPI and select the Schedule panel.

Select the “Both” radio button to enable searching in both Team Content and My Content, then press the submit button. NOTE: if you want to restrict your search to more specific areas of the content store, you can do so by clicking on the “Narrow” button.

After the query has completed you will see results. You can click on each item in the results panel to see detailed information.

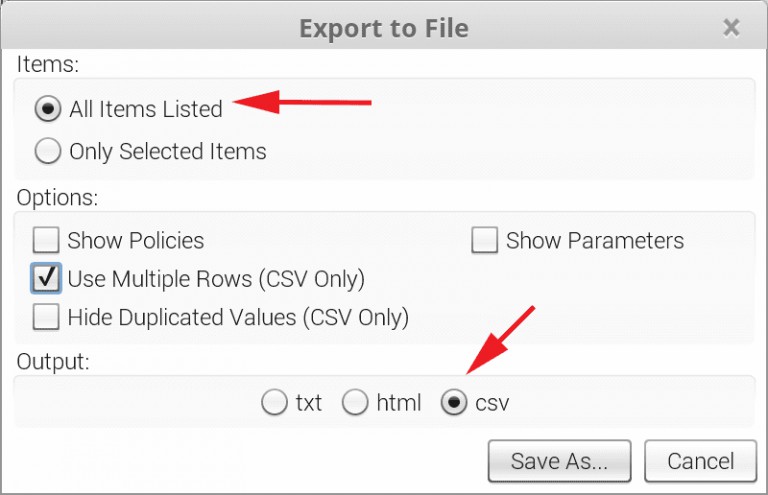
Now, to facilitate finding all schedules which deliver output to a given recipient, lets export the results to a CSV file. To do this, use the menu item: File | Export Output

Specify the format and destination file. This example depicted below exports all results to a CSV file.

Now we can open the CSV file up in Excel, and filter / search the schedule details by various attributes. In the use case outlined above (find which schedules are delivering outputs to a given user), we’ll want to look for that user’s email address or account name in the following columns (these correspond to “to”, “cc” and “bcc” fields on the generated emails) :

CSV Column Column Description
Email Outputs email addresses which will show on the “to” line
Email Cc Outputs email addresses which will show on the “cc” line
Email Bcc Outputs email addresses which will show on the “bcc” line
Account Outputs Account objects which will show on the “to” line of the email. Each Account object (“Cognos User”) has an optional, associated email address field. You can see this in Cognos Connection via : My Preferences -> Personal -> Email
Account Cc Outputs Account objects which will show on the “cc” line of the email. Each Account object (“Cognos User”) has an optional, associated email address field. You can see this in Cognos Connection via : My Preferences -> Personal -> Email
Account Bcc Outputs Account objects which will show on the “to” line of the email. Each Account object (“Cognos User”) has an optional, associated email address field. You can see this in Cognos Connection via : My Preferences -> Personal -> Email

A screenshot of an example CSV output is depicted below :

MotioPI is a free tool designed to improve many of the tedious tasks IBM Cognos administrators must face on a daily, weekly, monthly basis, such as the one outlined above. Click the button below to get your complimentary MotioPI software.

{{cta(‘663f2ce8-db71-46ad-bdc2-eb3c24989a1b’)}}

Scroll to Top
As the BI space evolves, organizations must take into account the bottom line of amassing analytics assets.
The more assets you have, the greater the cost to your business. There are the hard costs of keeping redundant assets, i.e., cloud or server capacity. Accumulating multiple versions of the same visualization not only takes up space, but BI vendors are moving to capacity pricing. Companies now pay more if you have more dashboards, apps, and reports. Earlier, we spoke about dependencies. Keeping redundant assets increases the number of dependencies and therefore the complexity. This comes with a price tag.
The implications of asset failures differ, and the business’s repercussions can be minimal or drastic.
Different industries have distinct regulatory requirements to meet. The impact may be minimal if a report for an end-of-year close has a mislabeled column that the sales or marketing department uses, On the other hand, if a healthcare or financial report does not meet the needs of a HIPPA or SOX compliance report, the company and its C-level suite may face severe penalties and reputational damage. Another example is a report that is shared externally. During an update of the report specs, the low-level security was incorrectly applied, which caused people to have access to personal information.
The complexity of assets influences their likelihood of encountering issues.
The last thing a business wants is for a report or app to fail at a crucial moment. If you know the report is complex and has a lot of dependencies, then the probability of failure caused by IT changes is high. That means a change request should be taken into account. Dependency graphs become important. If it is a straightforward sales report that tells notes by salesperson by account, any changes made do not have the same impact on the report, even if it fails. BI operations should treat these reports differently during change.
Not all reports and dashboards fail the same; some reports may lag, definitions might change, or data accuracy and relevance could wane. Understanding these variations aids in better risk anticipation.

Marketing uses several reports for its campaigns – standard analytic assets often delivered through marketing tools. Finance has very complex reports converted from Excel to BI tools while incorporating different consolidation rules. The marketing reports have a different failure mode than the financial reports. They, therefore, need to be managed differently.

It’s time for the company’s monthly business review. The marketing department proceeds to report on leads acquired per salesperson. Unfortunately, half the team has left the organization, and the data fails to load accurately. While this is an inconvenience for the marketing group, it isn’t detrimental to the business. However, a failure in financial reporting for a human resource consulting firm with 1000s contractors that contains critical and complex calculations about sickness, fees, hours, etc, has major implications and needs to be managed differently.

Acknowledging that assets transition through distinct phases allows for effective management decisions at each stage. As new visualizations are released, the information leads to broad use and adoption.
Think back to the start of the pandemic. COVID dashboards were quickly put together and released to the business, showing pertinent information: how the virus spreads, demographics affected the business and risks, etc. At the time, it was relevant and served its purpose. As we moved past the pandemic, COVID-specific information became obsolete, and reporting is integrated into regular HR reporting.
Reports and dashboards are crafted to deliver valuable insights for stakeholders. Over time, though, the worth of assets changes.
When a company opens its first store in a certain area, there are many elements it needs to understand – other stores in the area, traffic patterns, pricing of products, what products to sell, etc. Once the store is operational for some time, specifics are not as important, and it can adopt the standard reporting. The tailor-made analytic assets become irrelevant and no longer add value to the store manager.