Mass Update Cognos

Post: Mass Update Cognos using Search and Replace

Have you ever needed to update an image or change the footer text on hundreds of reports? Have you ever refactored your framework model and needed to change the query item names across all reports which are built on it? Have you ever renamed a report that is referenced as a drill target in many other reports?

If you have ever faced one of these scenarios, then you know how tedious it can be when you have to manually apply the same change across a large number of reports. This is where MotioPI Pro’s Search and Replace panel can save you a ton of time (and spare you a great deal of aggravation.)

The Search and Replace Panel in MotioPI is designed to allow bulk “search and replace” across a large number of Cognos specifications (e.g. “replace X with Y across all these reports.”) This allows you to quickly “mass update” Cognos reports.

Example – Mass Update Cognos Reports

Suppose you are a Cognos BI Author, and your company has decided to provide a smaller variant of its logo across an entire family of reports (for the purpose of this example, let’s assume there are 50 of these reports.) If you were to do this the “old-fashioned way” you would be required to open each report in Report Studio, click on the image, change the URL, and then save the report. You would repeat this process 50 times (once for each report!) With MotioPI, you can make the change in all 50 reports in one pass. Here’s how:

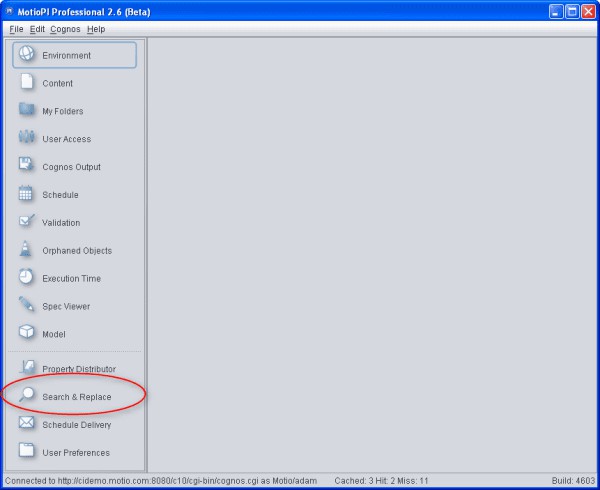
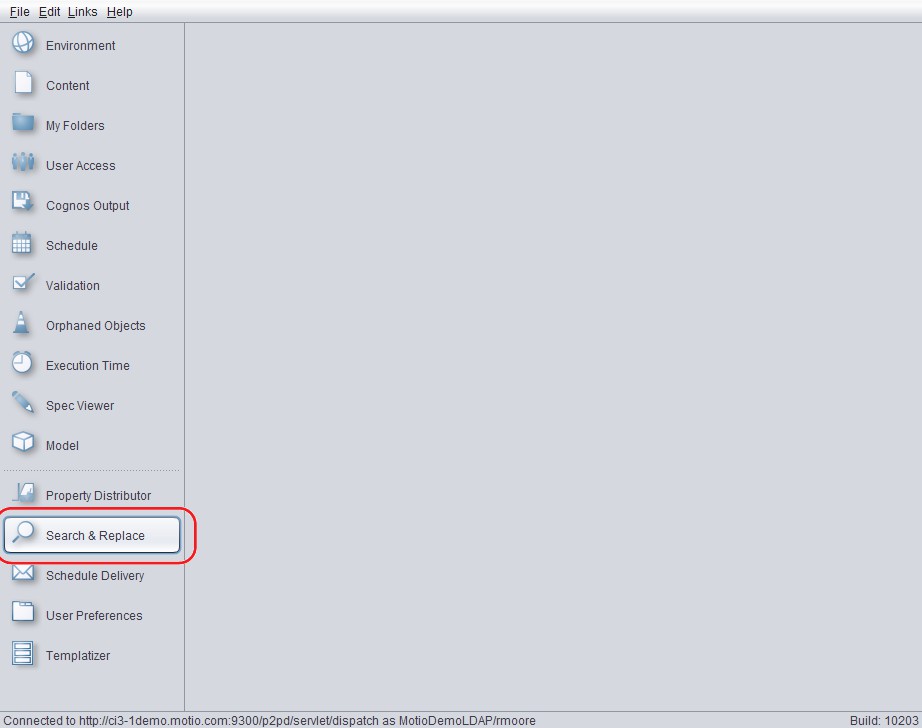
1. Login to MotioPI Professional and select the Search & Replace panel.

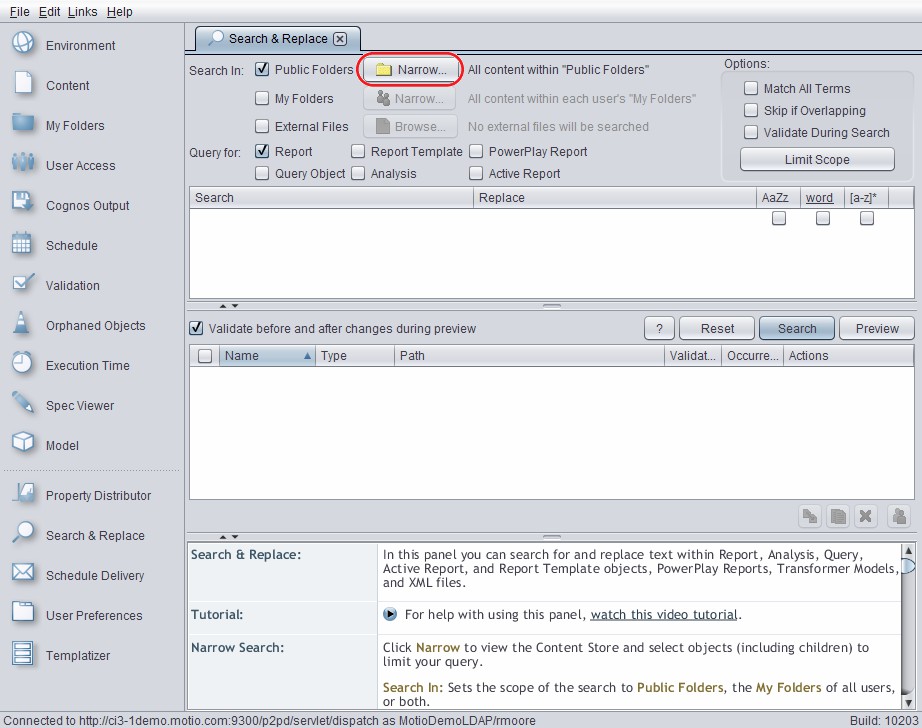
2. Click on the Narrow button to narrow down your scope (e.g. you can limit the operation to certain folders.)

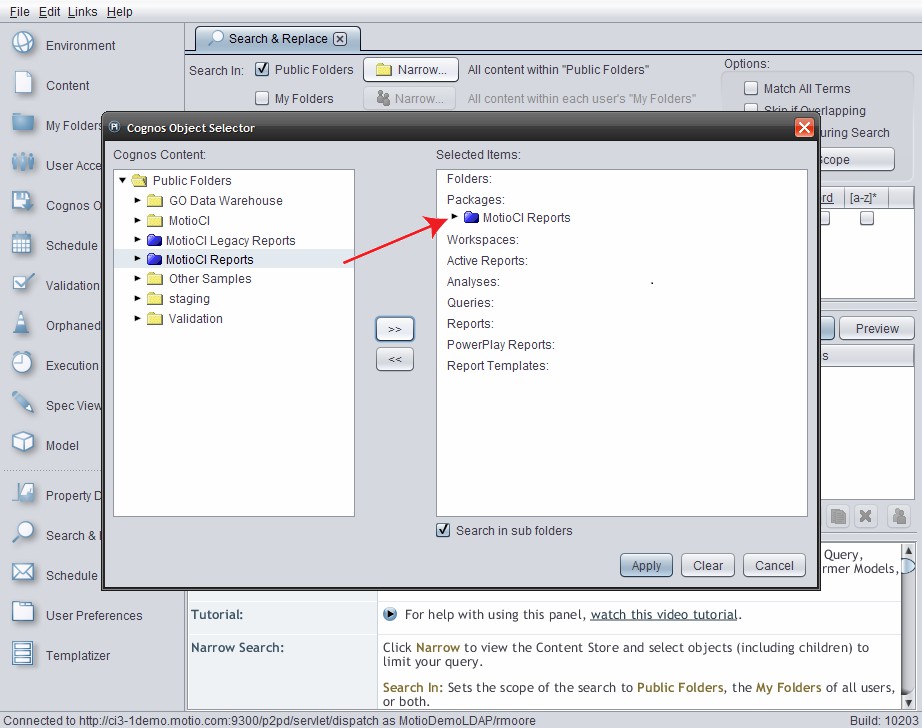
This opens the Cognos Object Selector. Select the objects you wish to search in. Click Apply.

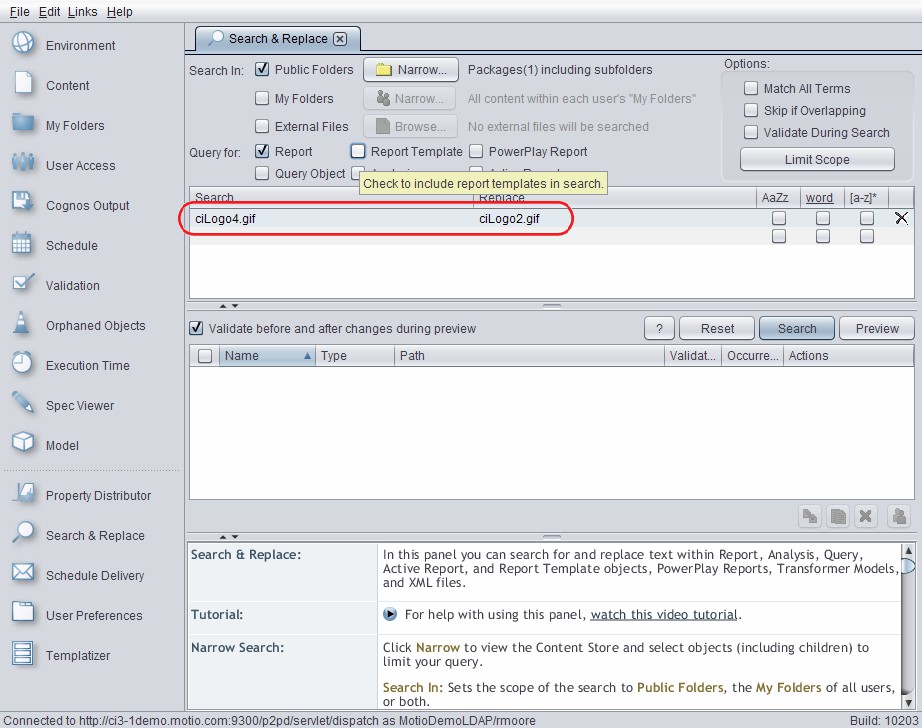
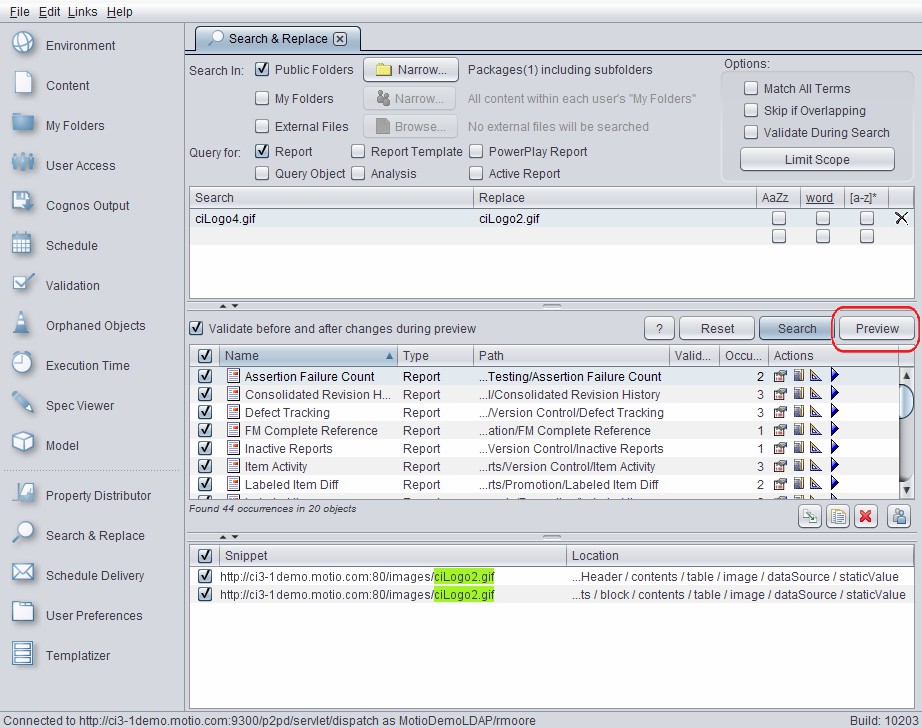
3. Enter the find text and the replace with text. In this example, we’re replacing “ciLogo4.gif” with “ciLogo2.gif”.


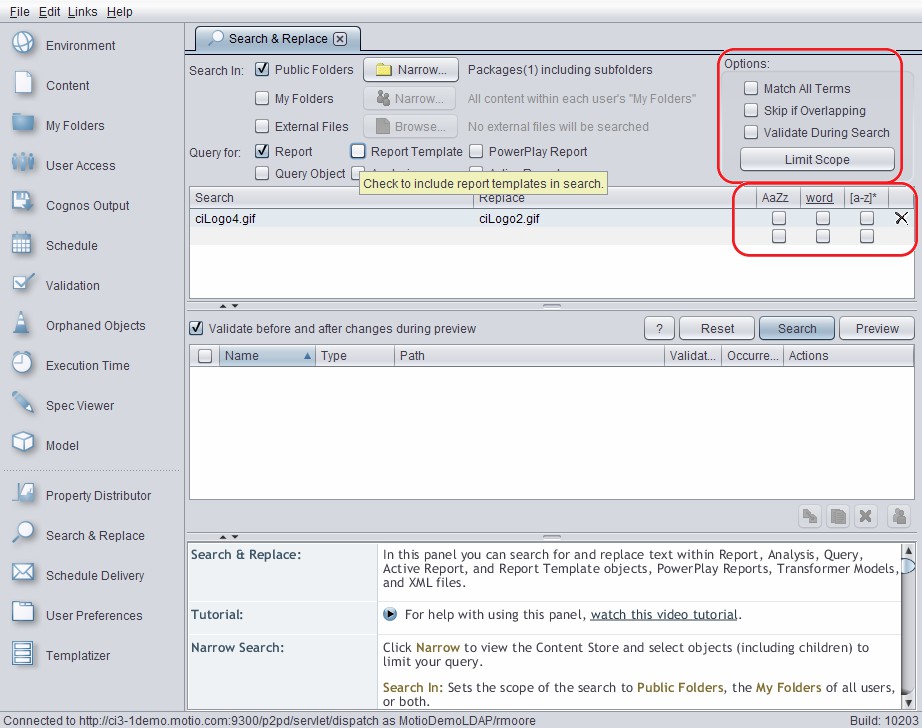
4. Select the appropriate checkboxes under the Types and Options sections (this allows you to control things like case sensitivity, affected object types, etc.) Click on the Search button.

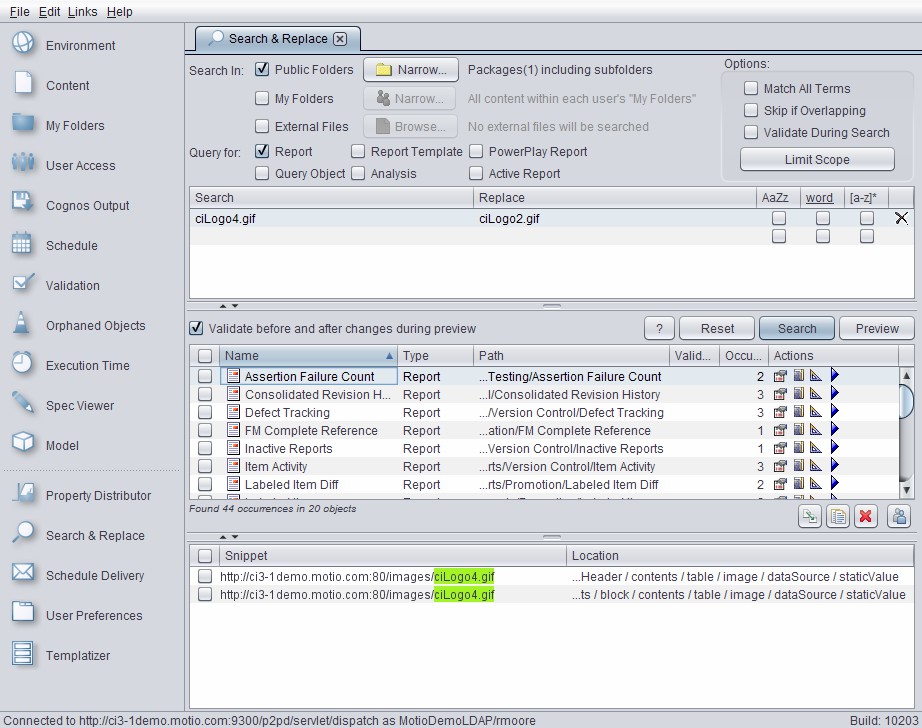
5. MotioPI will start retrieving all reports which are in the scope and contain the specified search pattern text. Each report which contains matches will be added to the results panel (the middle panel, as shown below.) If you click on one of the reports in the results panel, you will see the actual text in that report which matched your search expression, along with context about where it was found.

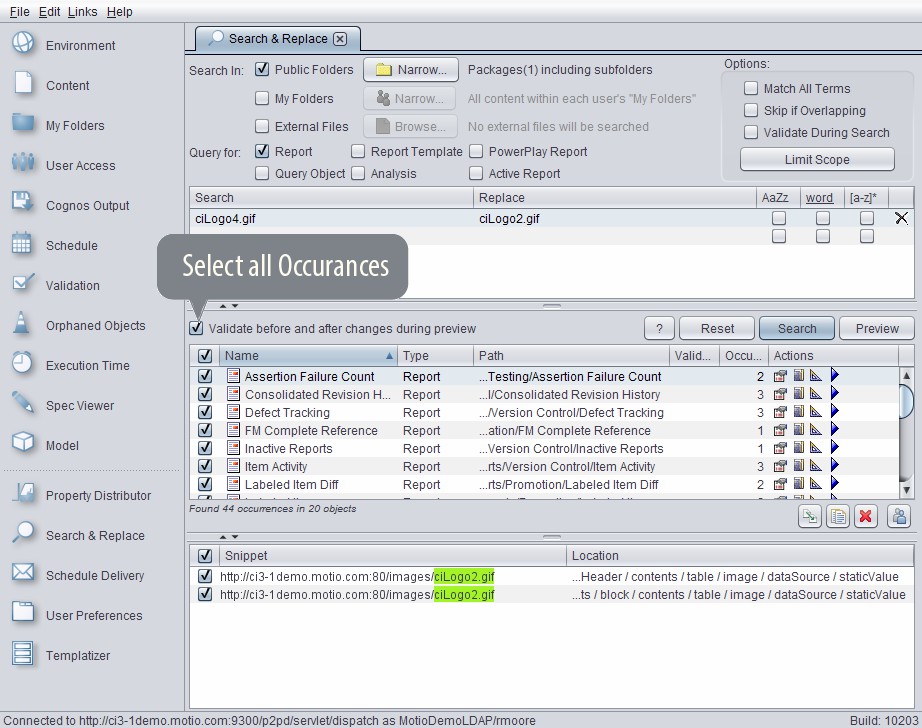
6. Now that you’ve found all occurrences of the search pattern text, you can pick and choose the ones to be replaced by using the checkboxes beside each report. To select all of the occurrences use the select all check box (shown below.)

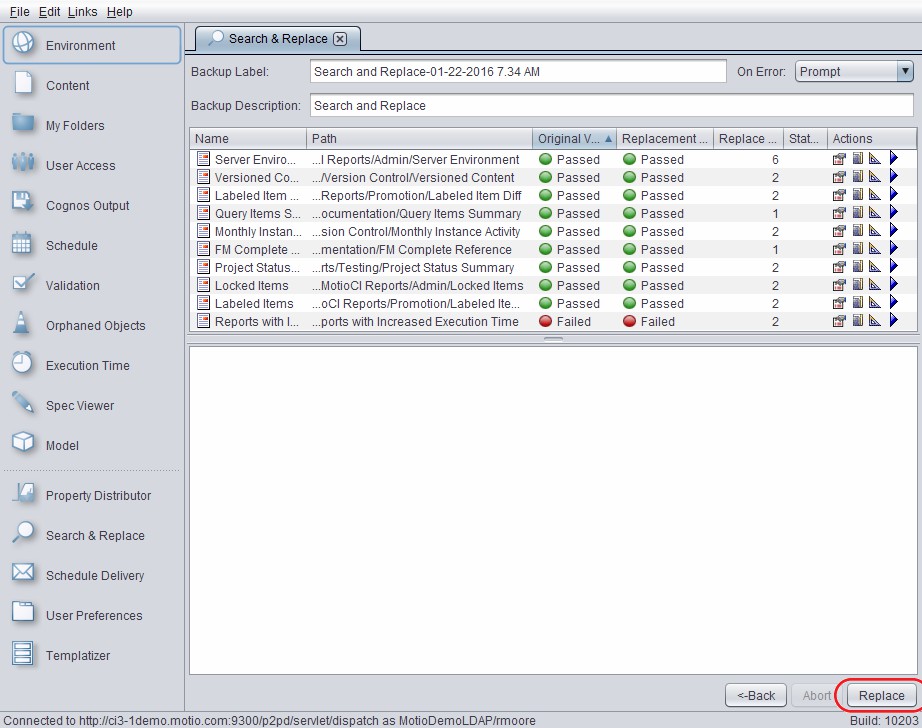
7. Now, click the preview button to preview the changes to the reports. This process will validate each report before and after the change. Note that the changes will NOT be saved to the content store during this stage.

8. Once the validation phase is complete, you can proceed with the actual replacement. Click the replace button to commit the changes to the reports (this is when the modified versions of the reports will be saved back to the content store.)

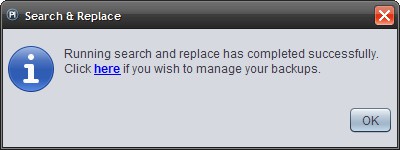
9. After the commit process is finished, you’ll see a Replace Complete dialog which provides a link to the backup folder in Cognos Connection (the original reports are all saved into this backup folder, in case you want to undo the operation.)

To summarize, you can use MotioPI Pro’s Search and Replace panel to replace text across a large number of Cognos report specifications with just a few clicks. This makes it far easier to apply bulk changes to Cognos reports.

Scroll to Top
As the BI space evolves, organizations must take into account the bottom line of amassing analytics assets.
The more assets you have, the greater the cost to your business. There are the hard costs of keeping redundant assets, i.e., cloud or server capacity. Accumulating multiple versions of the same visualization not only takes up space, but BI vendors are moving to capacity pricing. Companies now pay more if you have more dashboards, apps, and reports. Earlier, we spoke about dependencies. Keeping redundant assets increases the number of dependencies and therefore the complexity. This comes with a price tag.
The implications of asset failures differ, and the business’s repercussions can be minimal or drastic.
Different industries have distinct regulatory requirements to meet. The impact may be minimal if a report for an end-of-year close has a mislabeled column that the sales or marketing department uses, On the other hand, if a healthcare or financial report does not meet the needs of a HIPPA or SOX compliance report, the company and its C-level suite may face severe penalties and reputational damage. Another example is a report that is shared externally. During an update of the report specs, the low-level security was incorrectly applied, which caused people to have access to personal information.
The complexity of assets influences their likelihood of encountering issues.
The last thing a business wants is for a report or app to fail at a crucial moment. If you know the report is complex and has a lot of dependencies, then the probability of failure caused by IT changes is high. That means a change request should be taken into account. Dependency graphs become important. If it is a straightforward sales report that tells notes by salesperson by account, any changes made do not have the same impact on the report, even if it fails. BI operations should treat these reports differently during change.
Not all reports and dashboards fail the same; some reports may lag, definitions might change, or data accuracy and relevance could wane. Understanding these variations aids in better risk anticipation.

Marketing uses several reports for its campaigns – standard analytic assets often delivered through marketing tools. Finance has very complex reports converted from Excel to BI tools while incorporating different consolidation rules. The marketing reports have a different failure mode than the financial reports. They, therefore, need to be managed differently.

It’s time for the company’s monthly business review. The marketing department proceeds to report on leads acquired per salesperson. Unfortunately, half the team has left the organization, and the data fails to load accurately. While this is an inconvenience for the marketing group, it isn’t detrimental to the business. However, a failure in financial reporting for a human resource consulting firm with 1000s contractors that contains critical and complex calculations about sickness, fees, hours, etc, has major implications and needs to be managed differently.

Acknowledging that assets transition through distinct phases allows for effective management decisions at each stage. As new visualizations are released, the information leads to broad use and adoption.
Think back to the start of the pandemic. COVID dashboards were quickly put together and released to the business, showing pertinent information: how the virus spreads, demographics affected the business and risks, etc. At the time, it was relevant and served its purpose. As we moved past the pandemic, COVID-specific information became obsolete, and reporting is integrated into regular HR reporting.
Reports and dashboards are crafted to deliver valuable insights for stakeholders. Over time, though, the worth of assets changes.
When a company opens its first store in a certain area, there are many elements it needs to understand – other stores in the area, traffic patterns, pricing of products, what products to sell, etc. Once the store is operational for some time, specifics are not as important, and it can adopt the standard reporting. The tailor-made analytic assets become irrelevant and no longer add value to the store manager.