How you Spread Misinformation with Terrible Dashboards
Numbers by themselves are hard to read, and even harder to draw meaningful inferences from. It’s often the case that visualizing the data in the forms of various graphics and charts is necessary to do any real data analysis.
However, if you’ve spent any amount of time looking at various graphs, you’ll have realized one thing long ago – not all data visualizations are created equal.
This will be a quick rundown of some of the most common mistakes people make when creating charts to represent the data in a quickly and easily digestible way.
Bad Maps
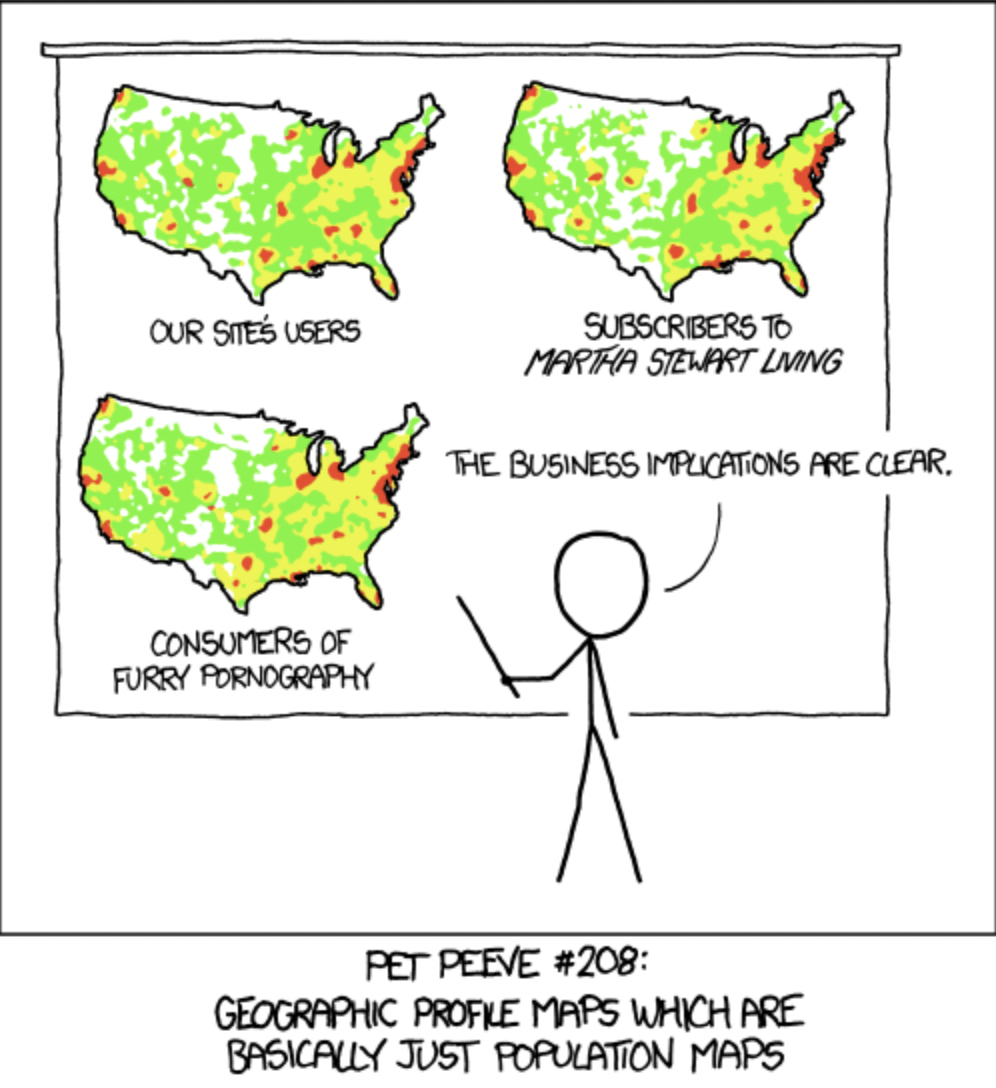
Following up on the xkcd at the start, it’s really common to see data put on a map in a way that’s terrible and useless. One of the biggest and most common offenders is the one shown in the comic.
Uninteresting Population Distributions
As it turns out, people tend to live in cities these days.
You should only bother showing a map if the expected distribution you observe does not align with the distribution of total population in the US.
For instance, if you were selling frozen tacos and found out that over half of your sales were coming from grocery stores in West Virginia despite their presence in markets nationwide, that would be quite remarkable.
Showing a map indicating this, as well as where else the tacos are popular, could provide useful information.
In a similar vein, if you sell a product that’s entirely in English, you should expect your distribution of customers to align with the distribution of english speakers worldwide.
Bad Grain Size
Another way to mess up a map is by choosing a poor way to break up the land geographically into chunks. This issue of finding the right smallest unit is a common one throughout BI, and visualizations are not an exception.
To make it more clear what I’m talking about, let’s look at two examples of the same grain size having two very different effects.
First, let’s look at somebody making a topographic map of the United States by shading the point of highest elevation in each county a different color along a defined key.
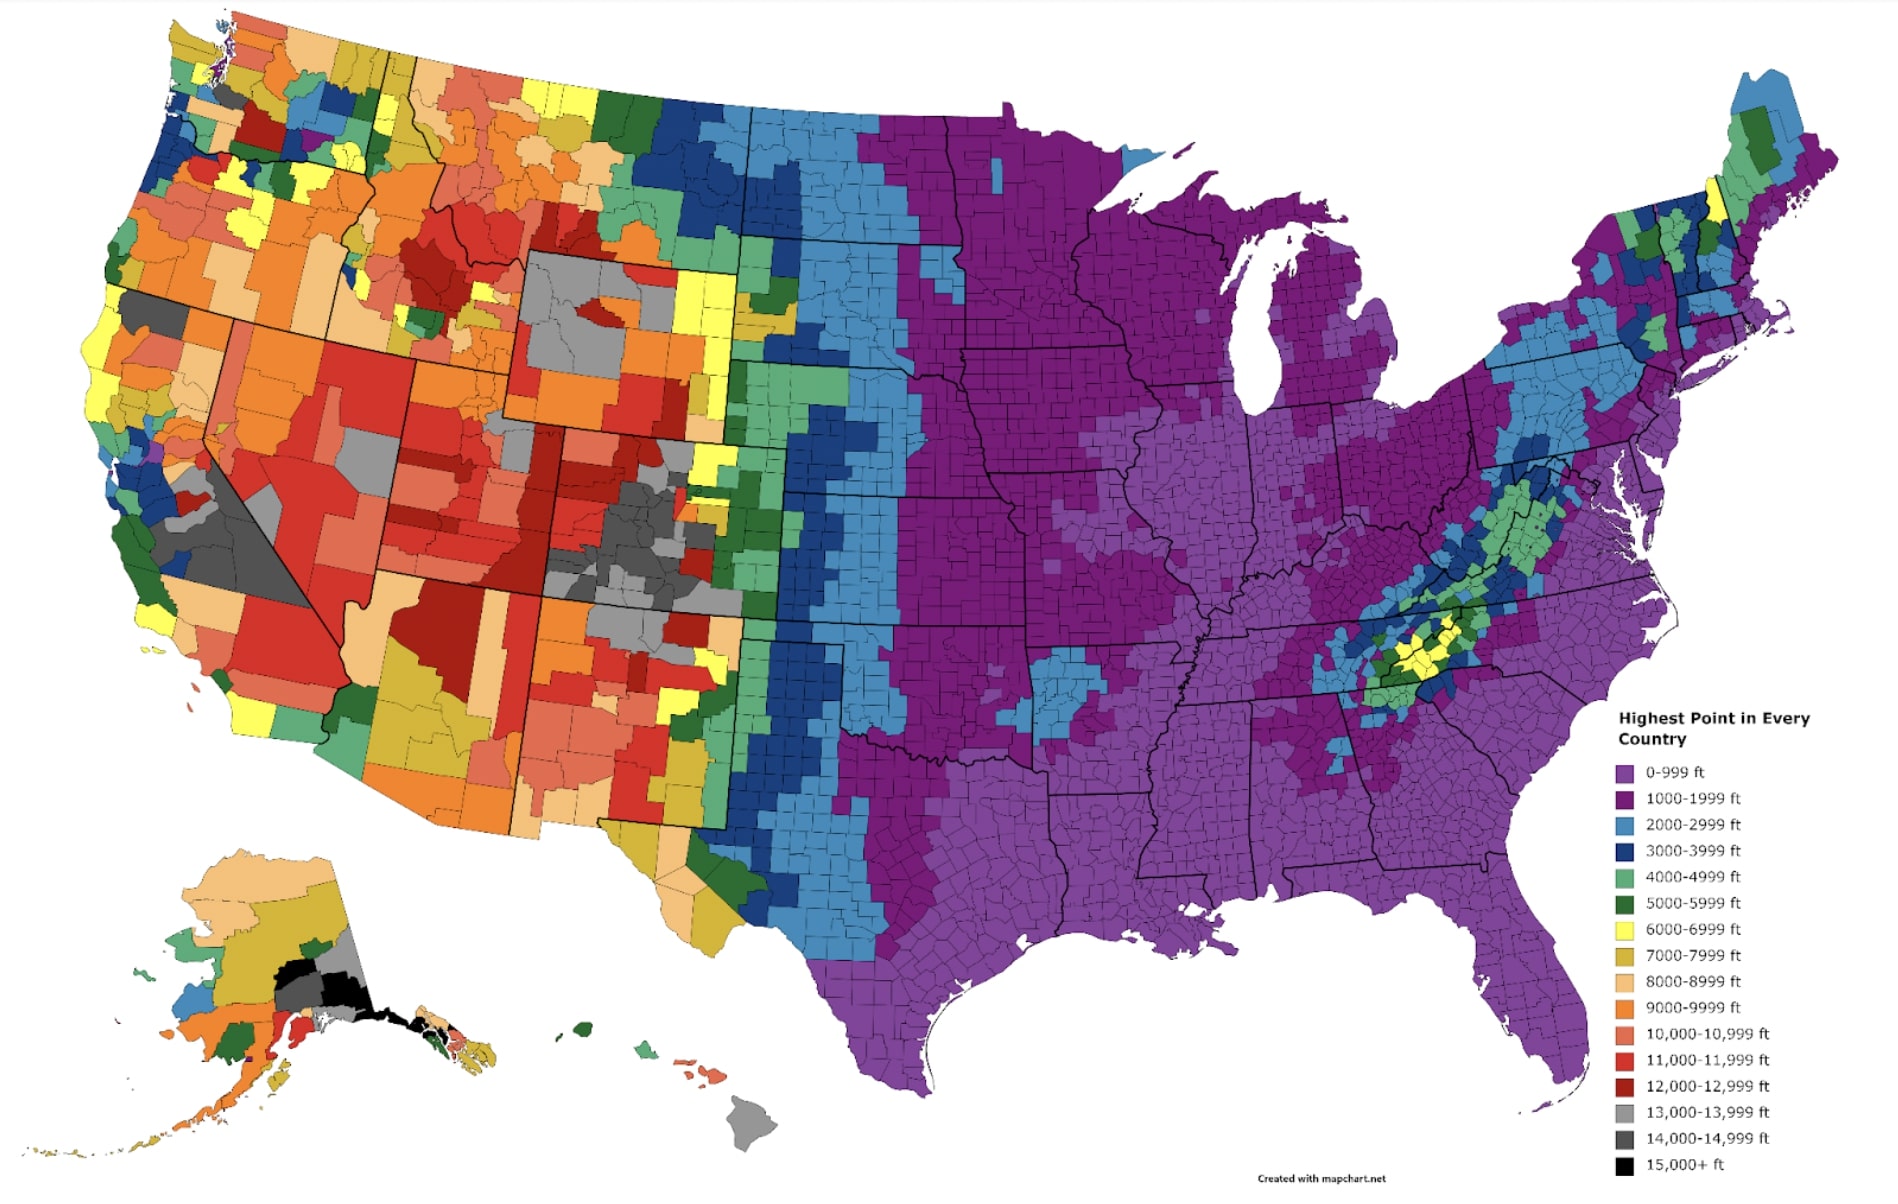
While it’s somewhat effective for the east coast, but once you hit the edge of the Rockies, it’s really just all noise.
You do not get a very good picture of the geography because (for complicated historical reasons) county sizes tend to get larger the further west you go. They tell a story, just not one relevant to geography.
Contrast this with a map of religious affiliation by county.
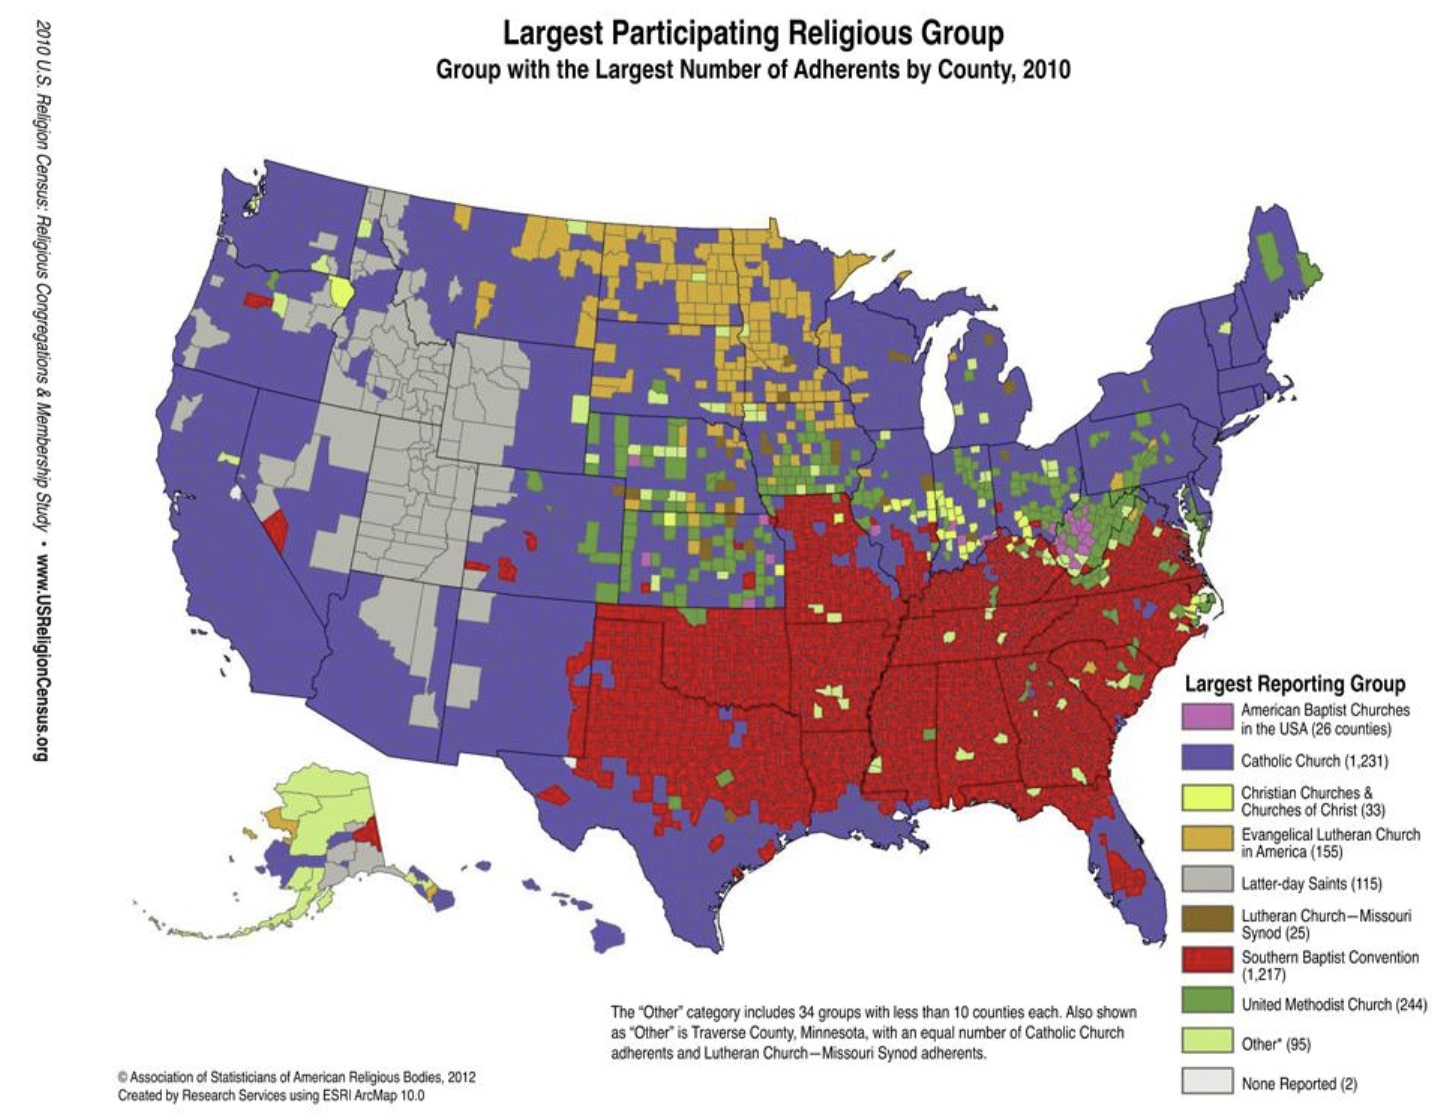
This map is totally effective, despite using the exact same grain size. We’re able to make quick, accurate, and meaningful inferences about regions of the United States, how these regions might be perceived, what the people who live there may think of themselves and the rest of the country.
Making an effective map as a visual aid, while difficult, can be very useful and elucidating. Just be sure to put some thought into what your map is trying to communicate.
Bad Bar Graphs
Bar graphs are generally more common than information presented on a map. They’re simple to read, simple to create, and generally pretty sleek.
Even though they’re easy to make, there are some common mistakes people can make while trying to reinvent the wheel.
Misleading Scales
One of the most common examples of bad bar graphs is when somebody does something untoward with the left axis.
This a particularly insidious problem, and difficult to give blanket guidelines. To make this problem a little easier to digest, let’s discuss some examples.
Let’s imagine a company that makes three products; Alpha, Beta, and Gamma widgets. The executive wants to know how well they’re selling compared to each other, and the BI team whips up a graph for them.
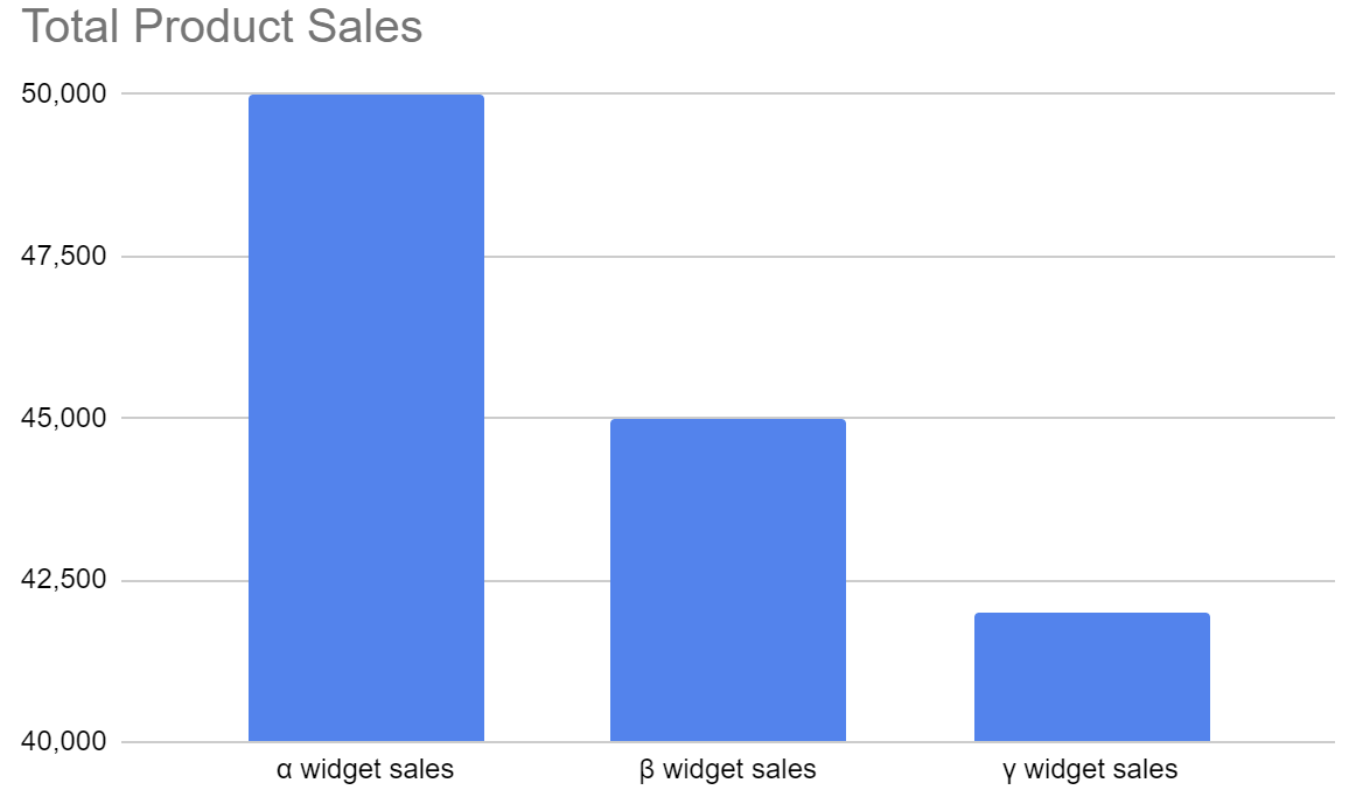
At a glance, the executive would get the impression that the Alpha Widgets are far outselling the competition, when in reality, they outsell Gamma widgets by just about 20% – not 500% as is implied in the visualization.
This is an example of a very obviously heinous distortion – or is it? Could we imagine a case where this exact same distortion would be more useful than a vanilla 0 – 50,000 axis?
For example, let’s imagine the same company except now the executive wants to know something different.
In this case, each widget only turns a profit if they sell at least 45,000 units. To find out how well each product is doing compared to each other and in relation to this floor, the BI team gets to work and submits the following visualization.
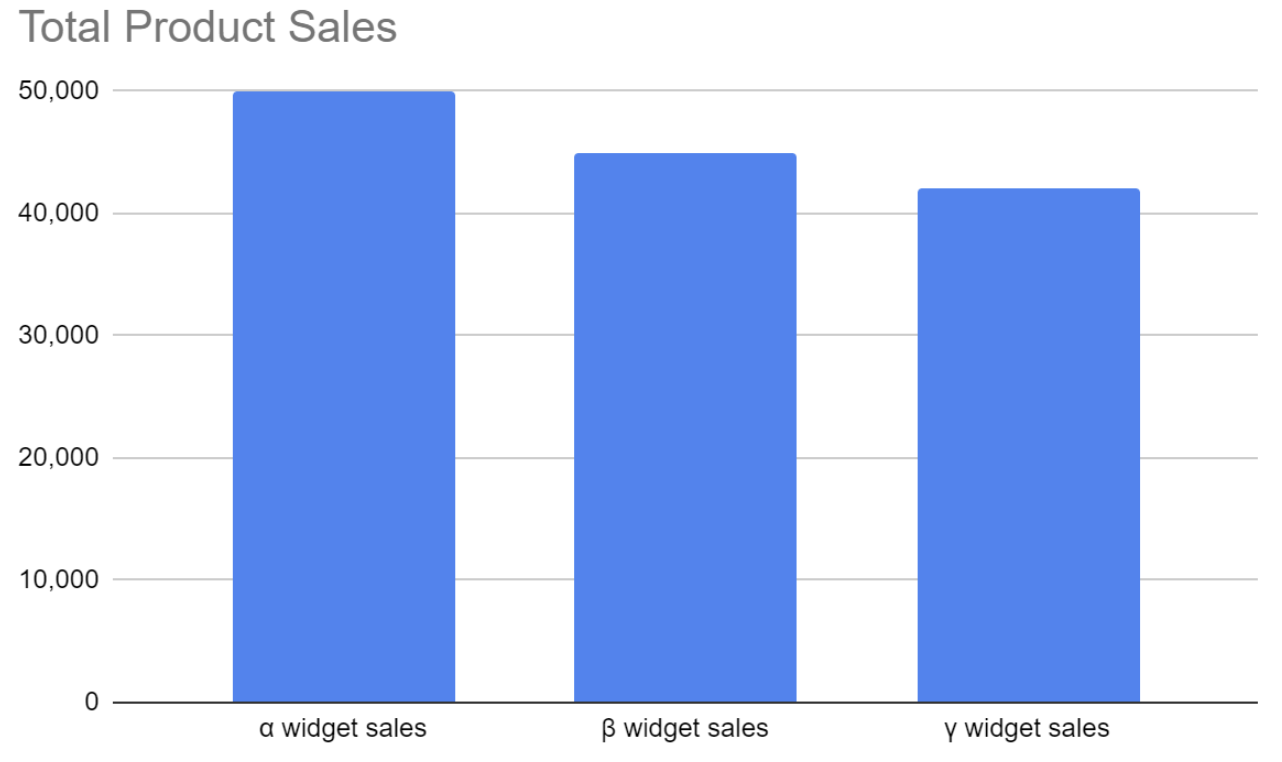
They’re all, in absolute terms, within a 20% window of each other, but how close are they to the all important 45,000 mark?
It looks like Gamma widgets are falling a little short, but are Beta widgets? The 45,000 line isn’t even labeled.
Magnifying the graph around that key axis, in this case, would be highly informative.
Cases like these make giving blanket advice very difficult. It’s best to exercise caution. Carefully analyze each situation before stretching and cropping the y axis with reckless abandon.
Gimmick Bars
A much less scary and simple misuse of bar graphs is when people try to get too cute with their visualizations. It’s true that a vanilla bar chart can be a little boring, so it makes sense that people would try to spice it up.
A well known example is the infamous case of the giant Latvian women.
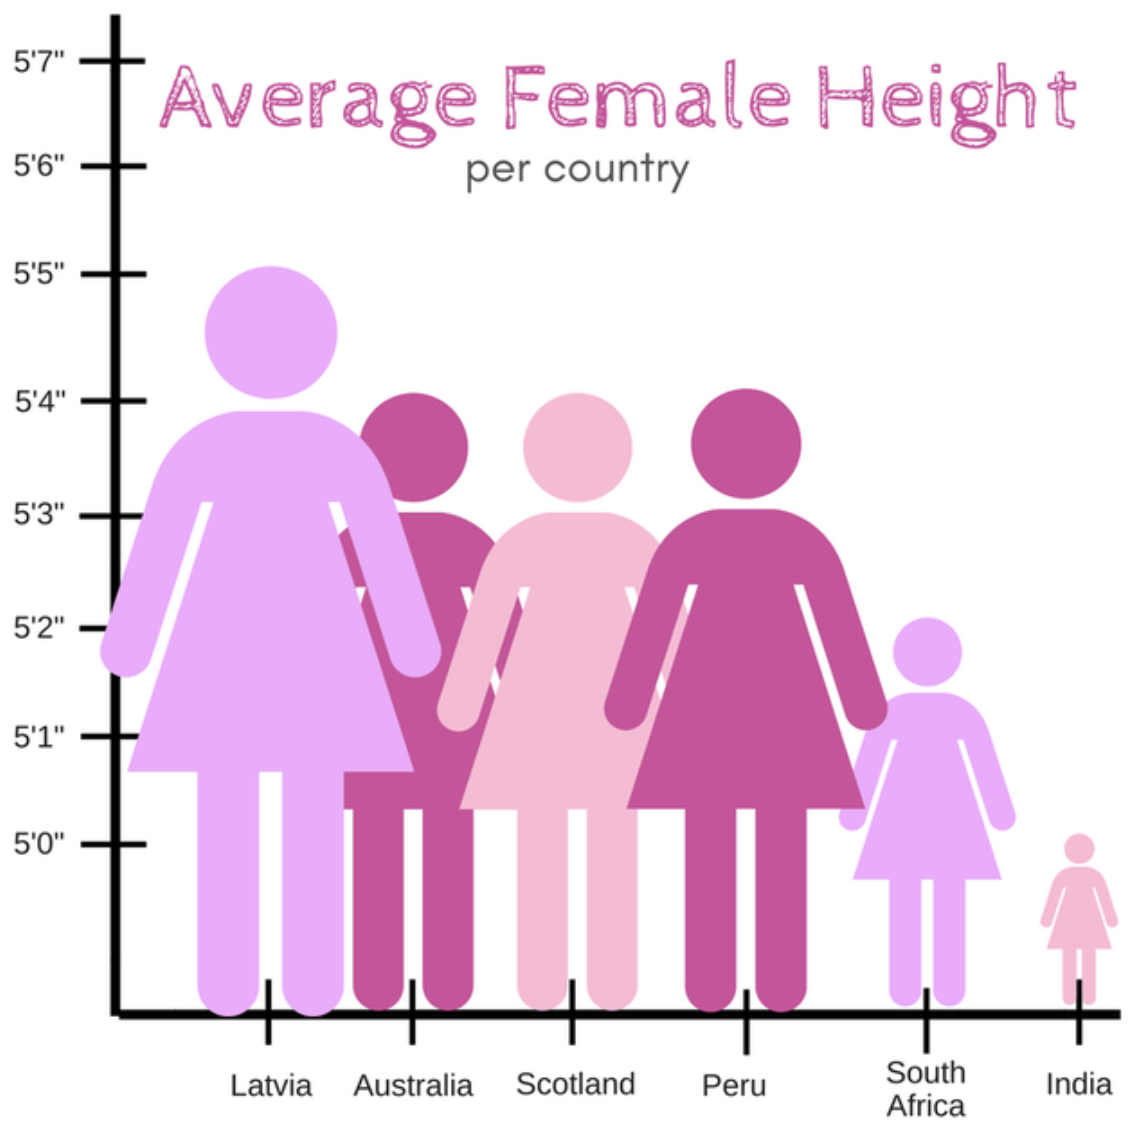
In some ways, this is relevant to some issues discussed in the previous section. If the creator of the graph had included the entire y axis all the way to 0’0’’, then Indian women wouldn’t look like pixies compared to the giantess Latvians.
Of course, if they had just used bars, the problem would also go away. They’re boring, but they’re also effective.
Bad Pie Charts
Pie charts are the enemy of mankind. They’re terrible in nearly every way. This is more than a passionate opinion espoused by the author, this is objective, scientific fact.
There are more ways to get pie charts wrong than there are to get them right. They have extremely narrow applications, and even in those, it’s questionable as to whether they’re the most effective tool for the job.
That being said, let’s just talk about the most egregious missteps.
Overcrowded Charts
This mistake isn’t extremely common, but it is extremely annoying when it comes up. It also demonstrates one of the fundamental problems with pi charts.
Let’s look at the following example, a pie chart showing the distribution of letter frequency in written English.
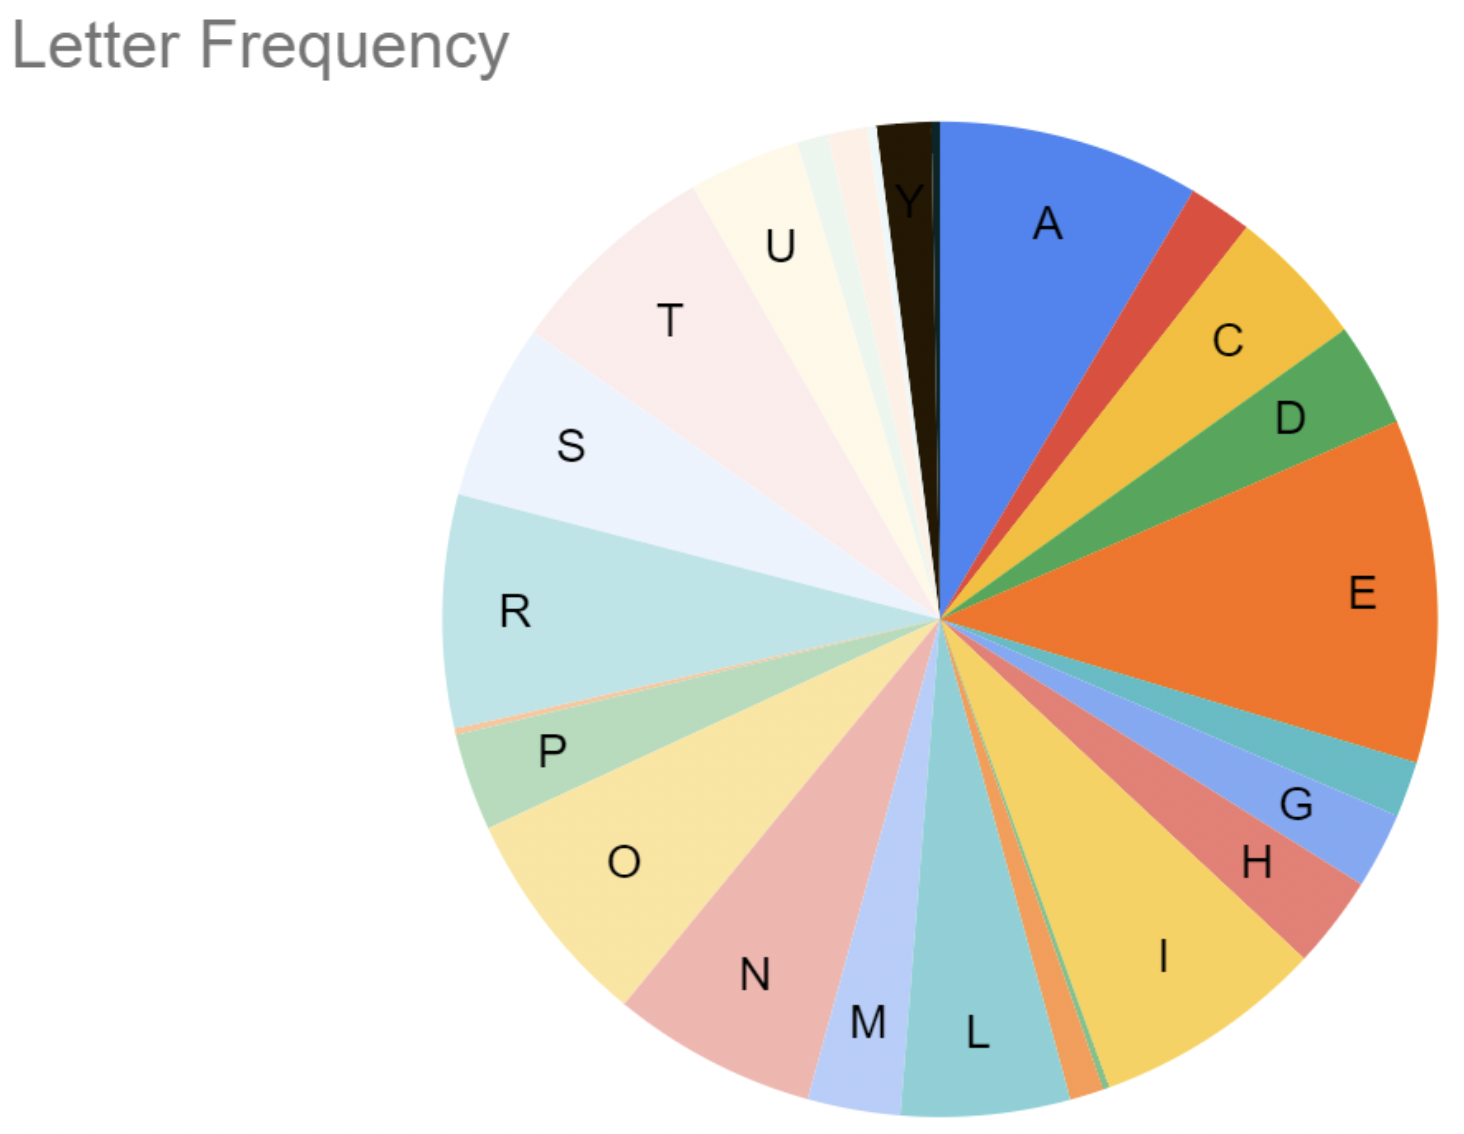
Looking at this chart, do you think you could say with confidence that I is more common than R? Or O? This is ignoring that some of the slices are too small to even fit a label on them.
Let’s compare this to a lovely, simple bar chart.
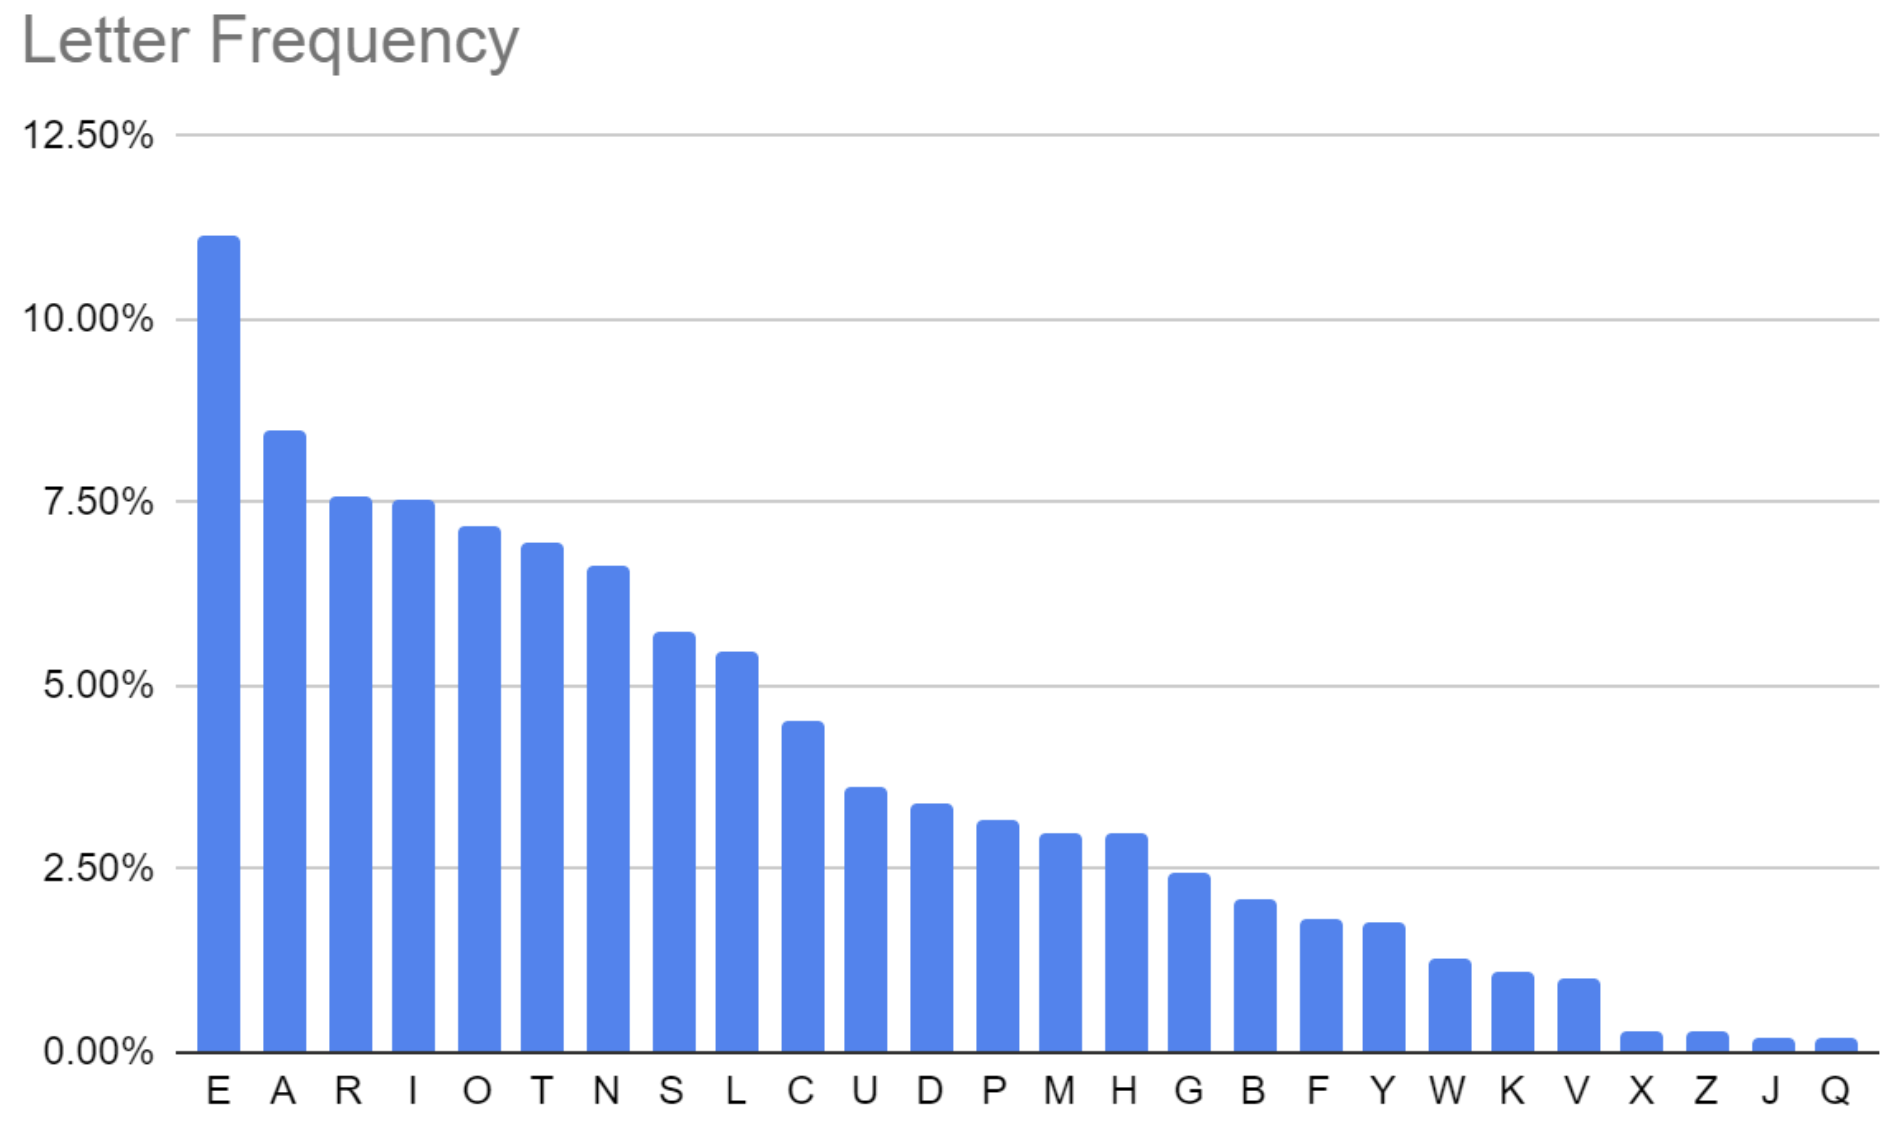
Poetry!
Not only can you immediately see each letter in relation to all the others, but you get an accurate intuition about their frequencies, and an easily visible axis displaying the actual percentages.
That previous chart? Unfixable. There are simply too many variables.
3D Charts
Another egregious abuse of pie charts is when people make them in 3D, oftentimes tilting them at unholy angles.
Let’s look at an example.
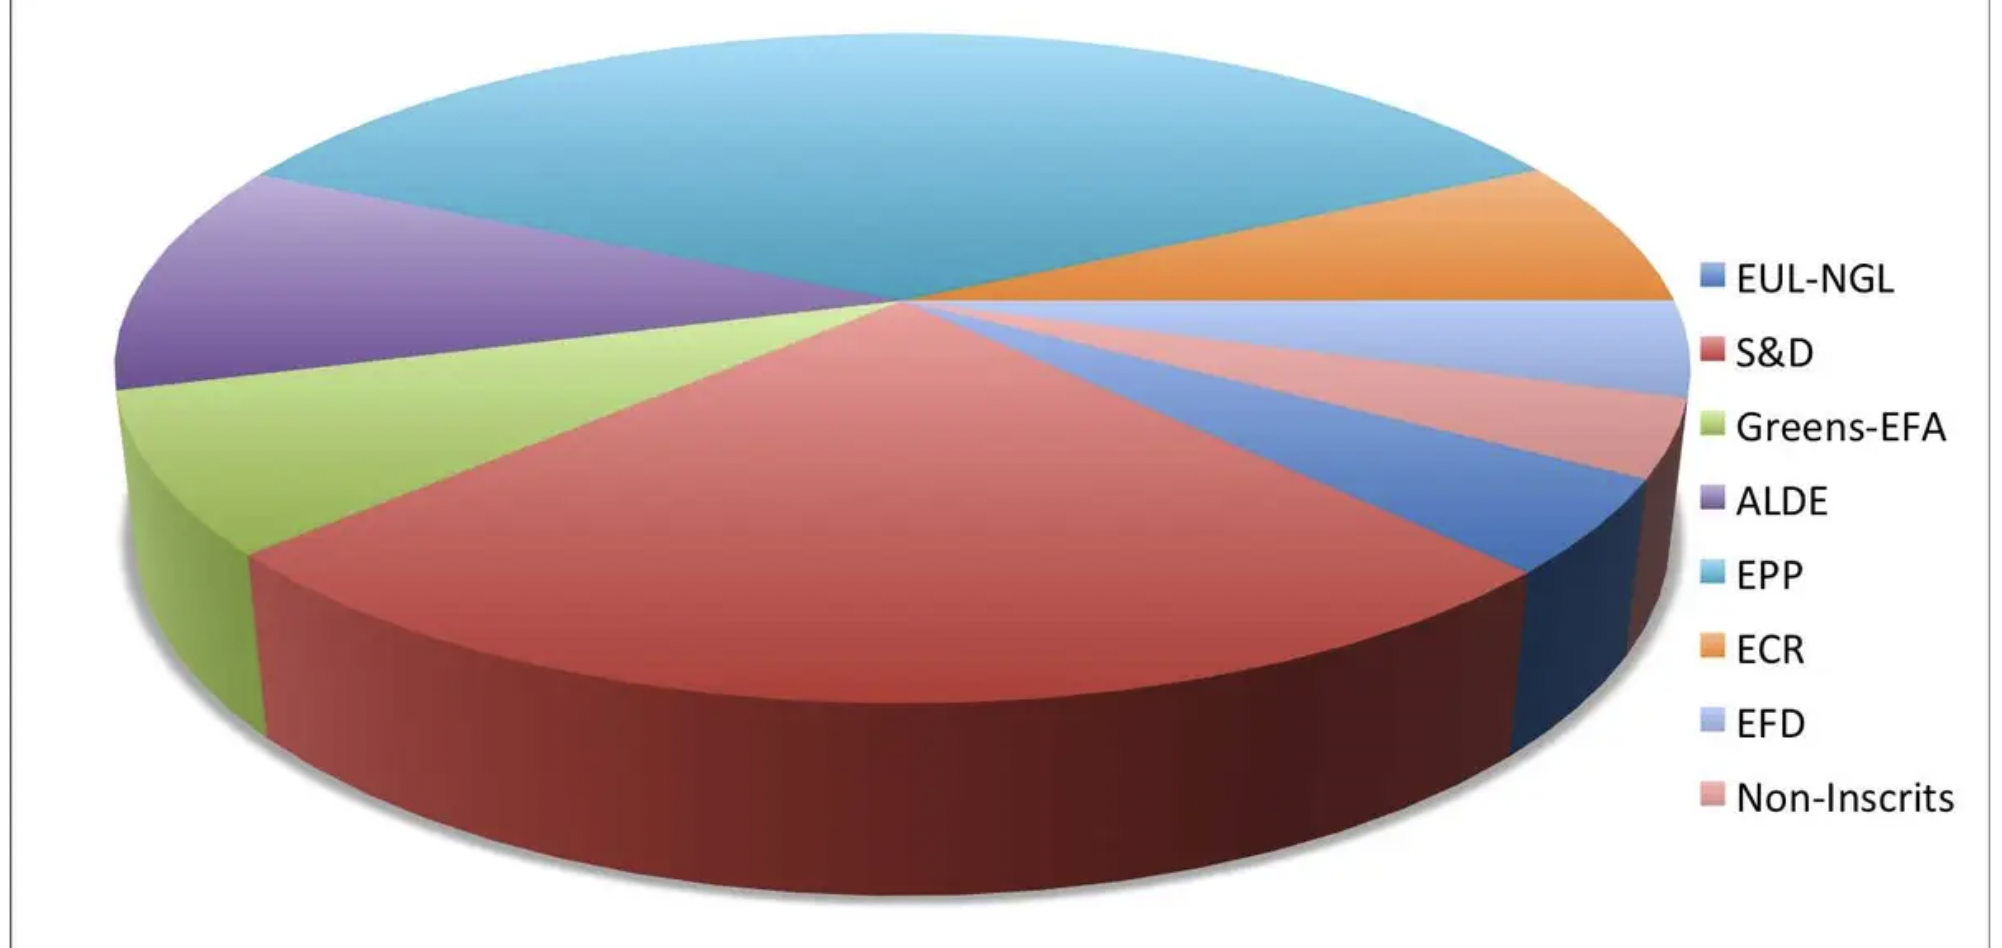
At a glance, the blue “EUL-NGL” looks about the same as the red “S&D,” but that is not the case. If we mentally correct for the tilt, the difference is much much larger than it seems.
There is no acceptable situation where this kind of 3D graph will function, it only exists to mislead the reader as to the relative scales.
Flat pie charts look just fine.
Poor Color Choices
The final mistake people tend to make is to pick inconsiderate color schemes. This is a small point compared to the others, but it can make a big difference for people.
Consider the following chart.
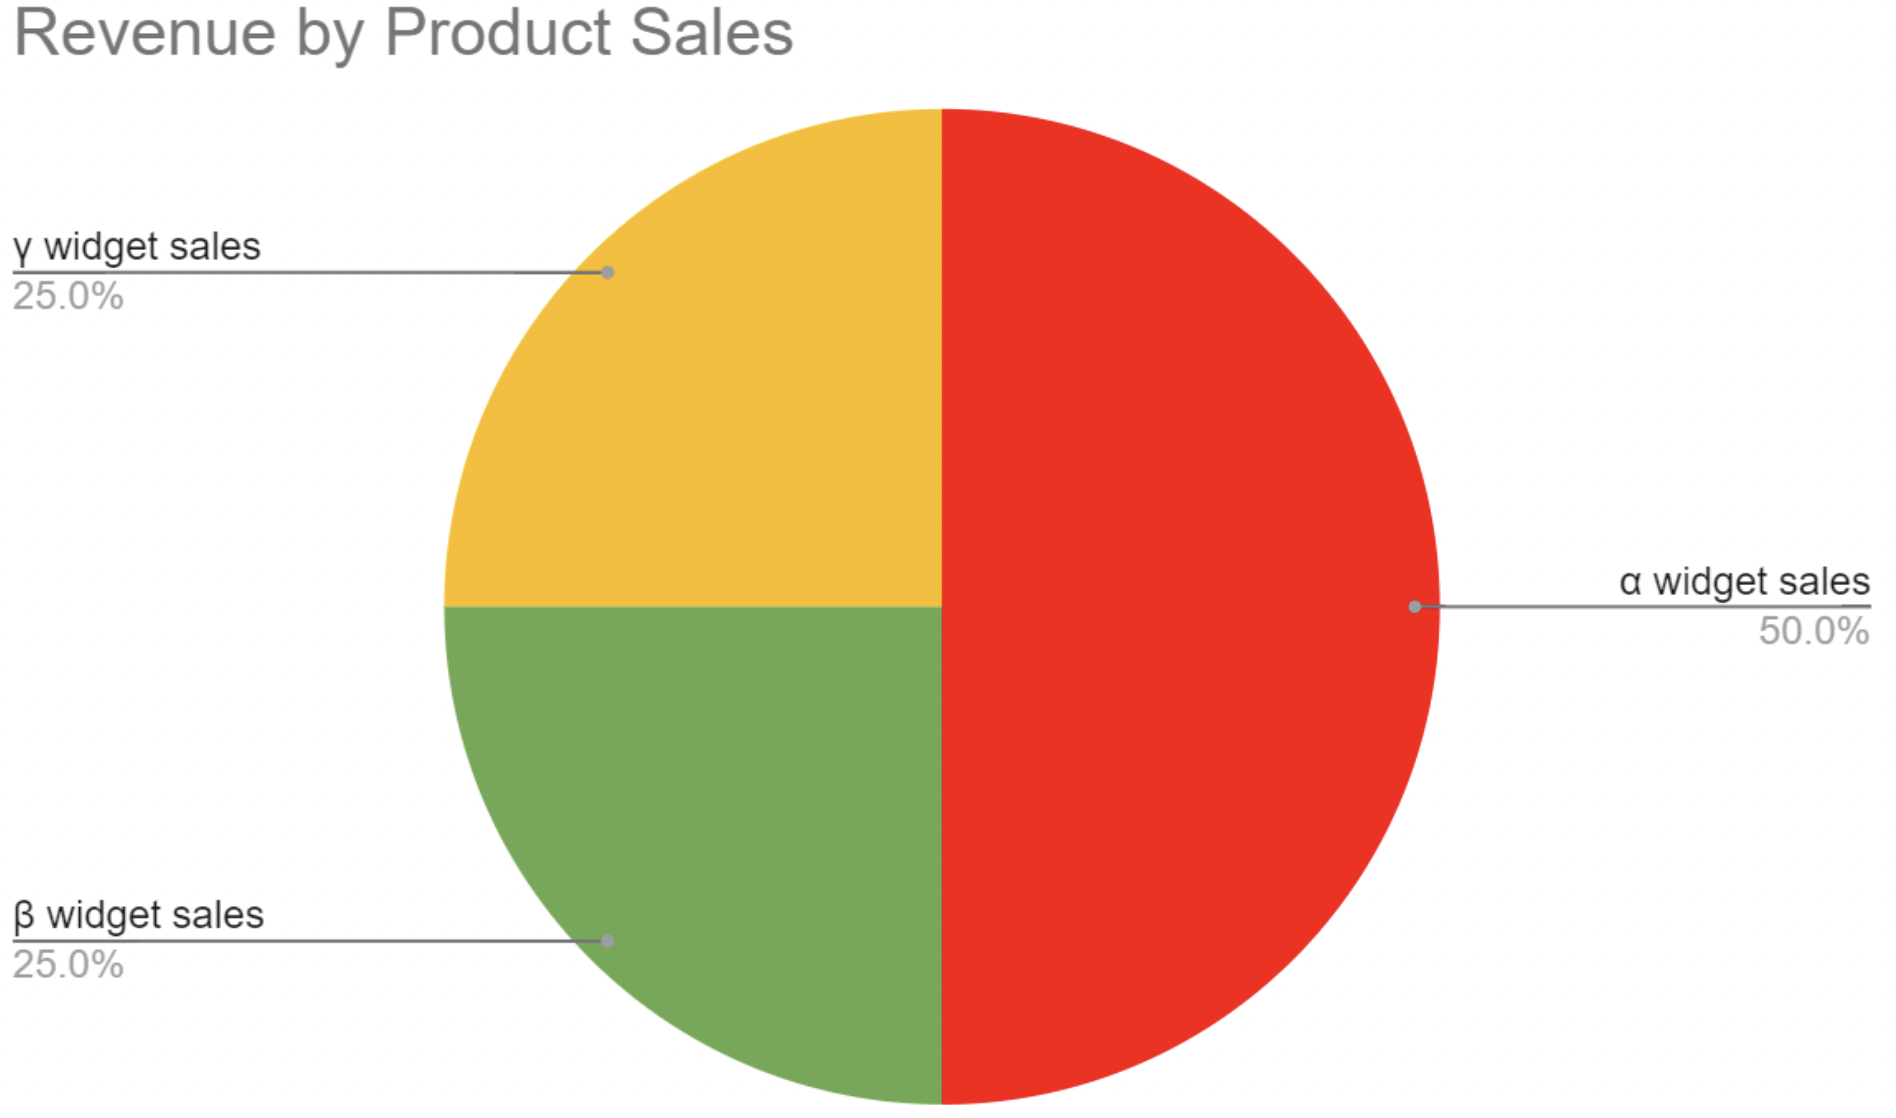
Chances are, this looks just fine to you. Everything is clearly labeled, the sizes have large enough discrepancies that it’s easy to see how the sales compared to each other.
However, if you suffer from color blindness, this is likely very annoying.
As a general rule, red and green should never be used on the same graph, particularly adjacent to one another.
Other color scheme errors should be obvious to everybody, such as picking 6 different slight shades or red.
Takeaways
There are many, many more ways to create data visualizations that are terrible and hinder how well people are able to understand data. All of them can be avoided with a little bit of thoughtfulness.
It’s important to consider how somebody else is going to see the graph, somebody who isn’t intimately familiar with the data. You need to have a deep understanding of what the goal of looking at the data is, and how best to highlight those parts without misleading people.