Post: Update the Default Action for Multiple Cognos Reports

MotioPI Pro provides a quick and easy way to mass update the Default Action for a set of Cognos reports.

First – let’s revisit the “Default Action” for a Cognos Report. This determines what Cognos does when a user clicks on a report in Cognos Connection. The field can be one of three values (shown below) :
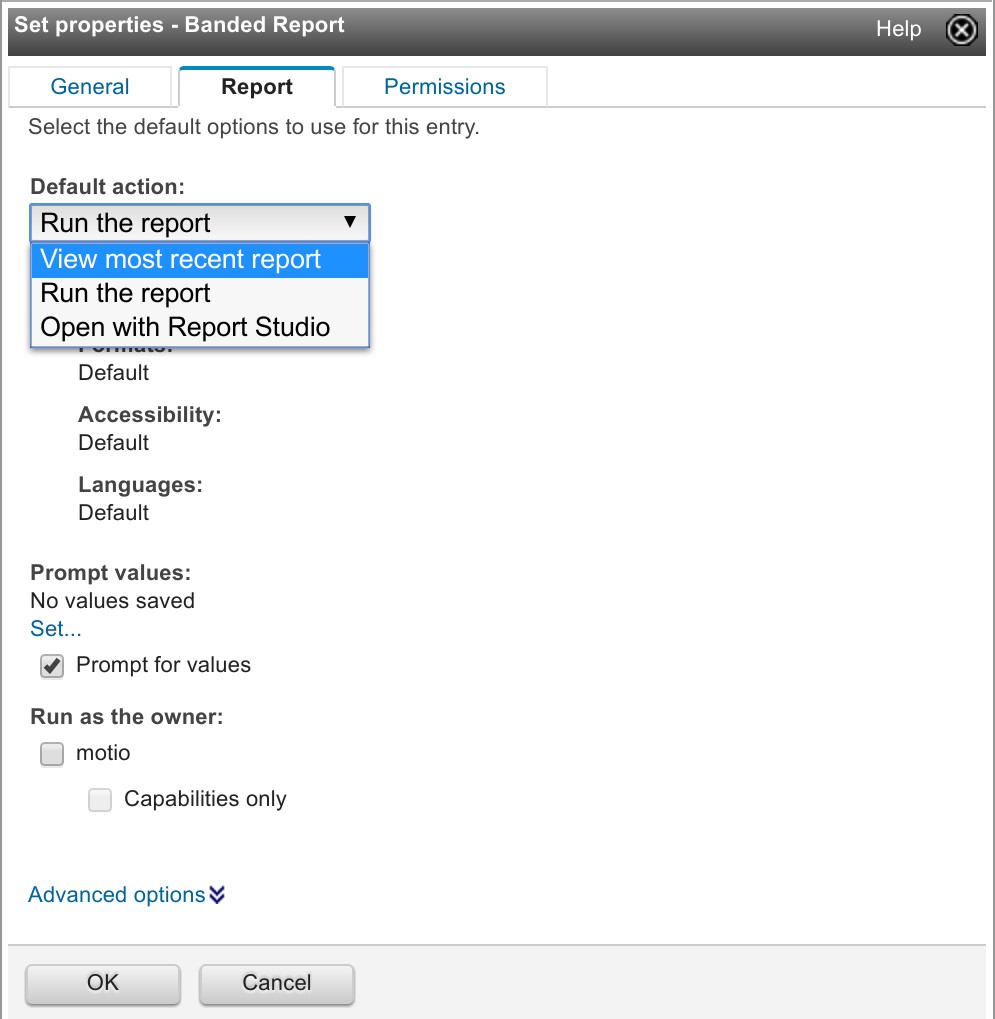
Click to enlarge

What if you needed to change this option to  “Run the report” for hundreds of reports?  It would be pretty tedious to do this one report at a time in Cognos Connection.

This is the type of operation where MotioPI Pro’s Property Distributor comes in handy.

Property Distributor lets you pick a single Cognos object as a “template”, and then allows you to replicate selected properties from this template object onto many other Cognos objects.

With that in mind, let’s walk through a quick example.

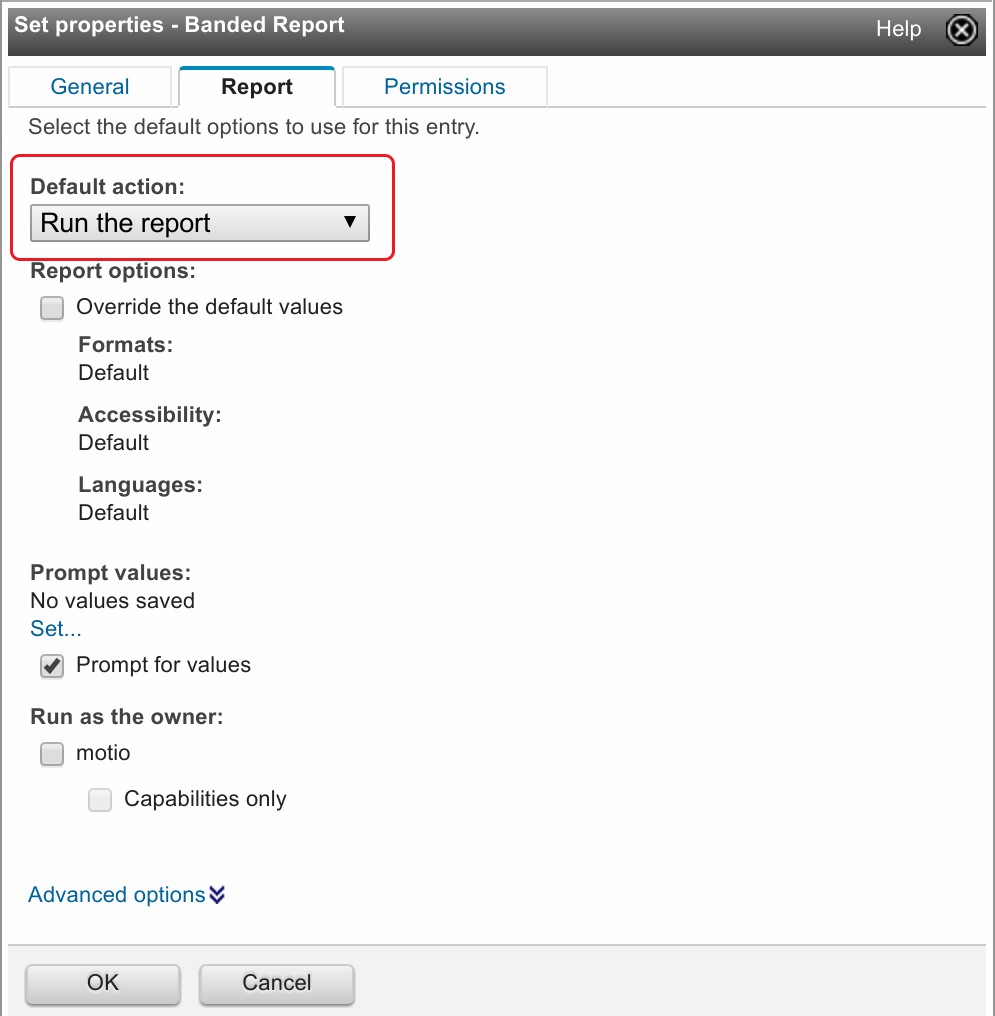
First, in Cognos Connection, let’s configure a template object to have a default action of “Run the report.” To do this, pick a report (any report will do, in the example below, we’re using “Banded Report”), click on its properties icon, and select the Report tab.

Switch the Default Action drop down to “Run the Report”, then Click OK

Click to enlarge

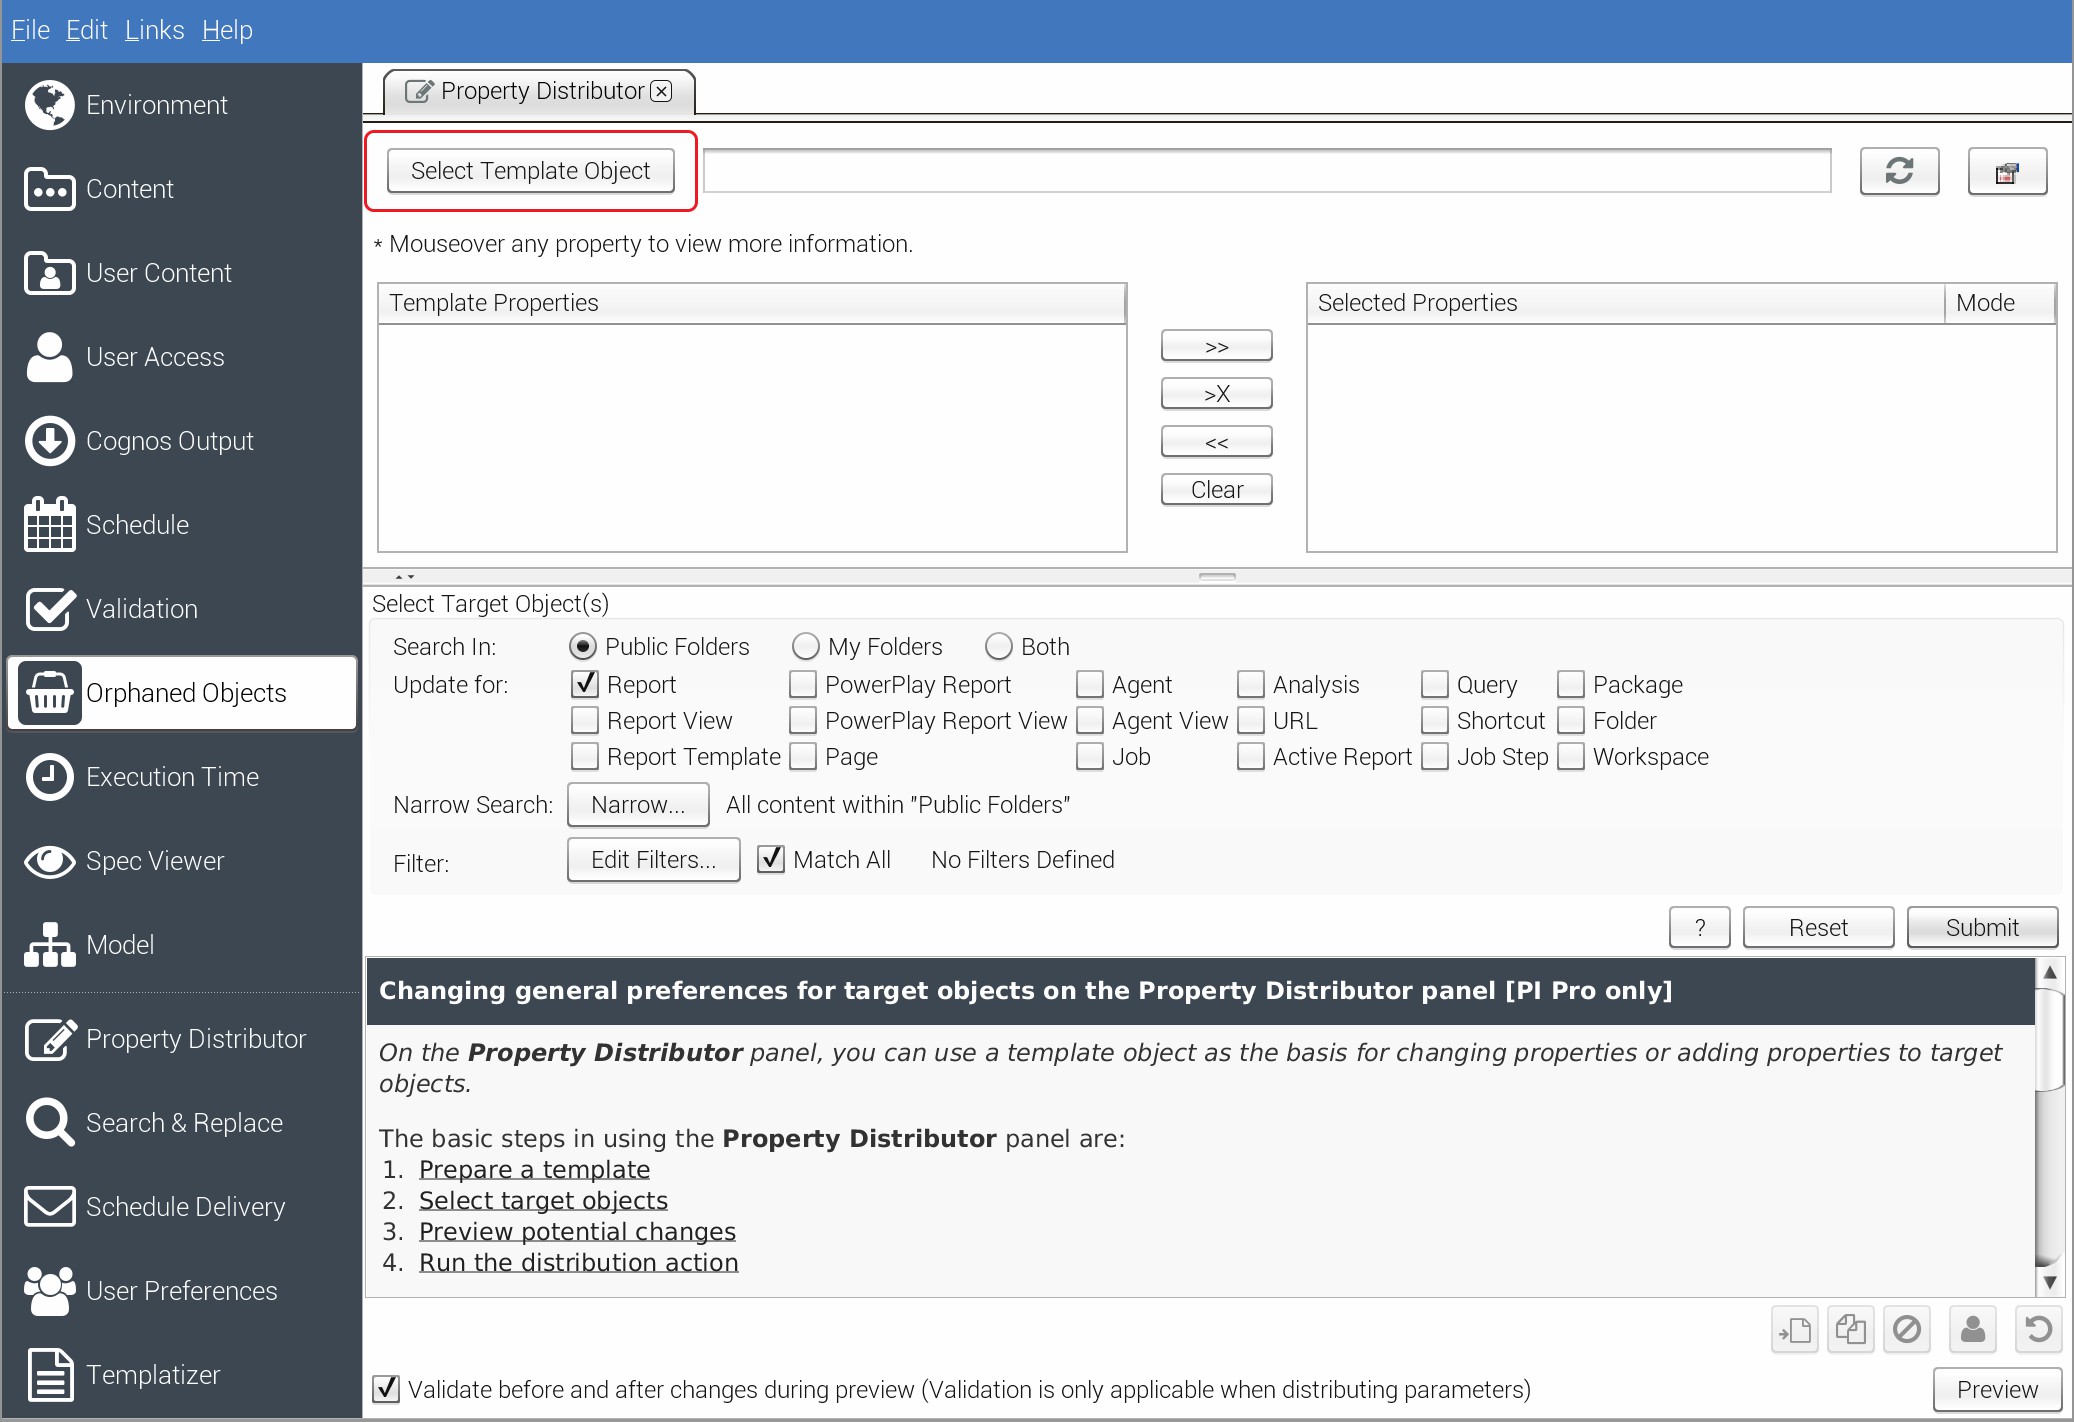
Now, inside MotioPI Pro, go to the Property Distributor panel click on the Select Template Object button.

Click to enlarge

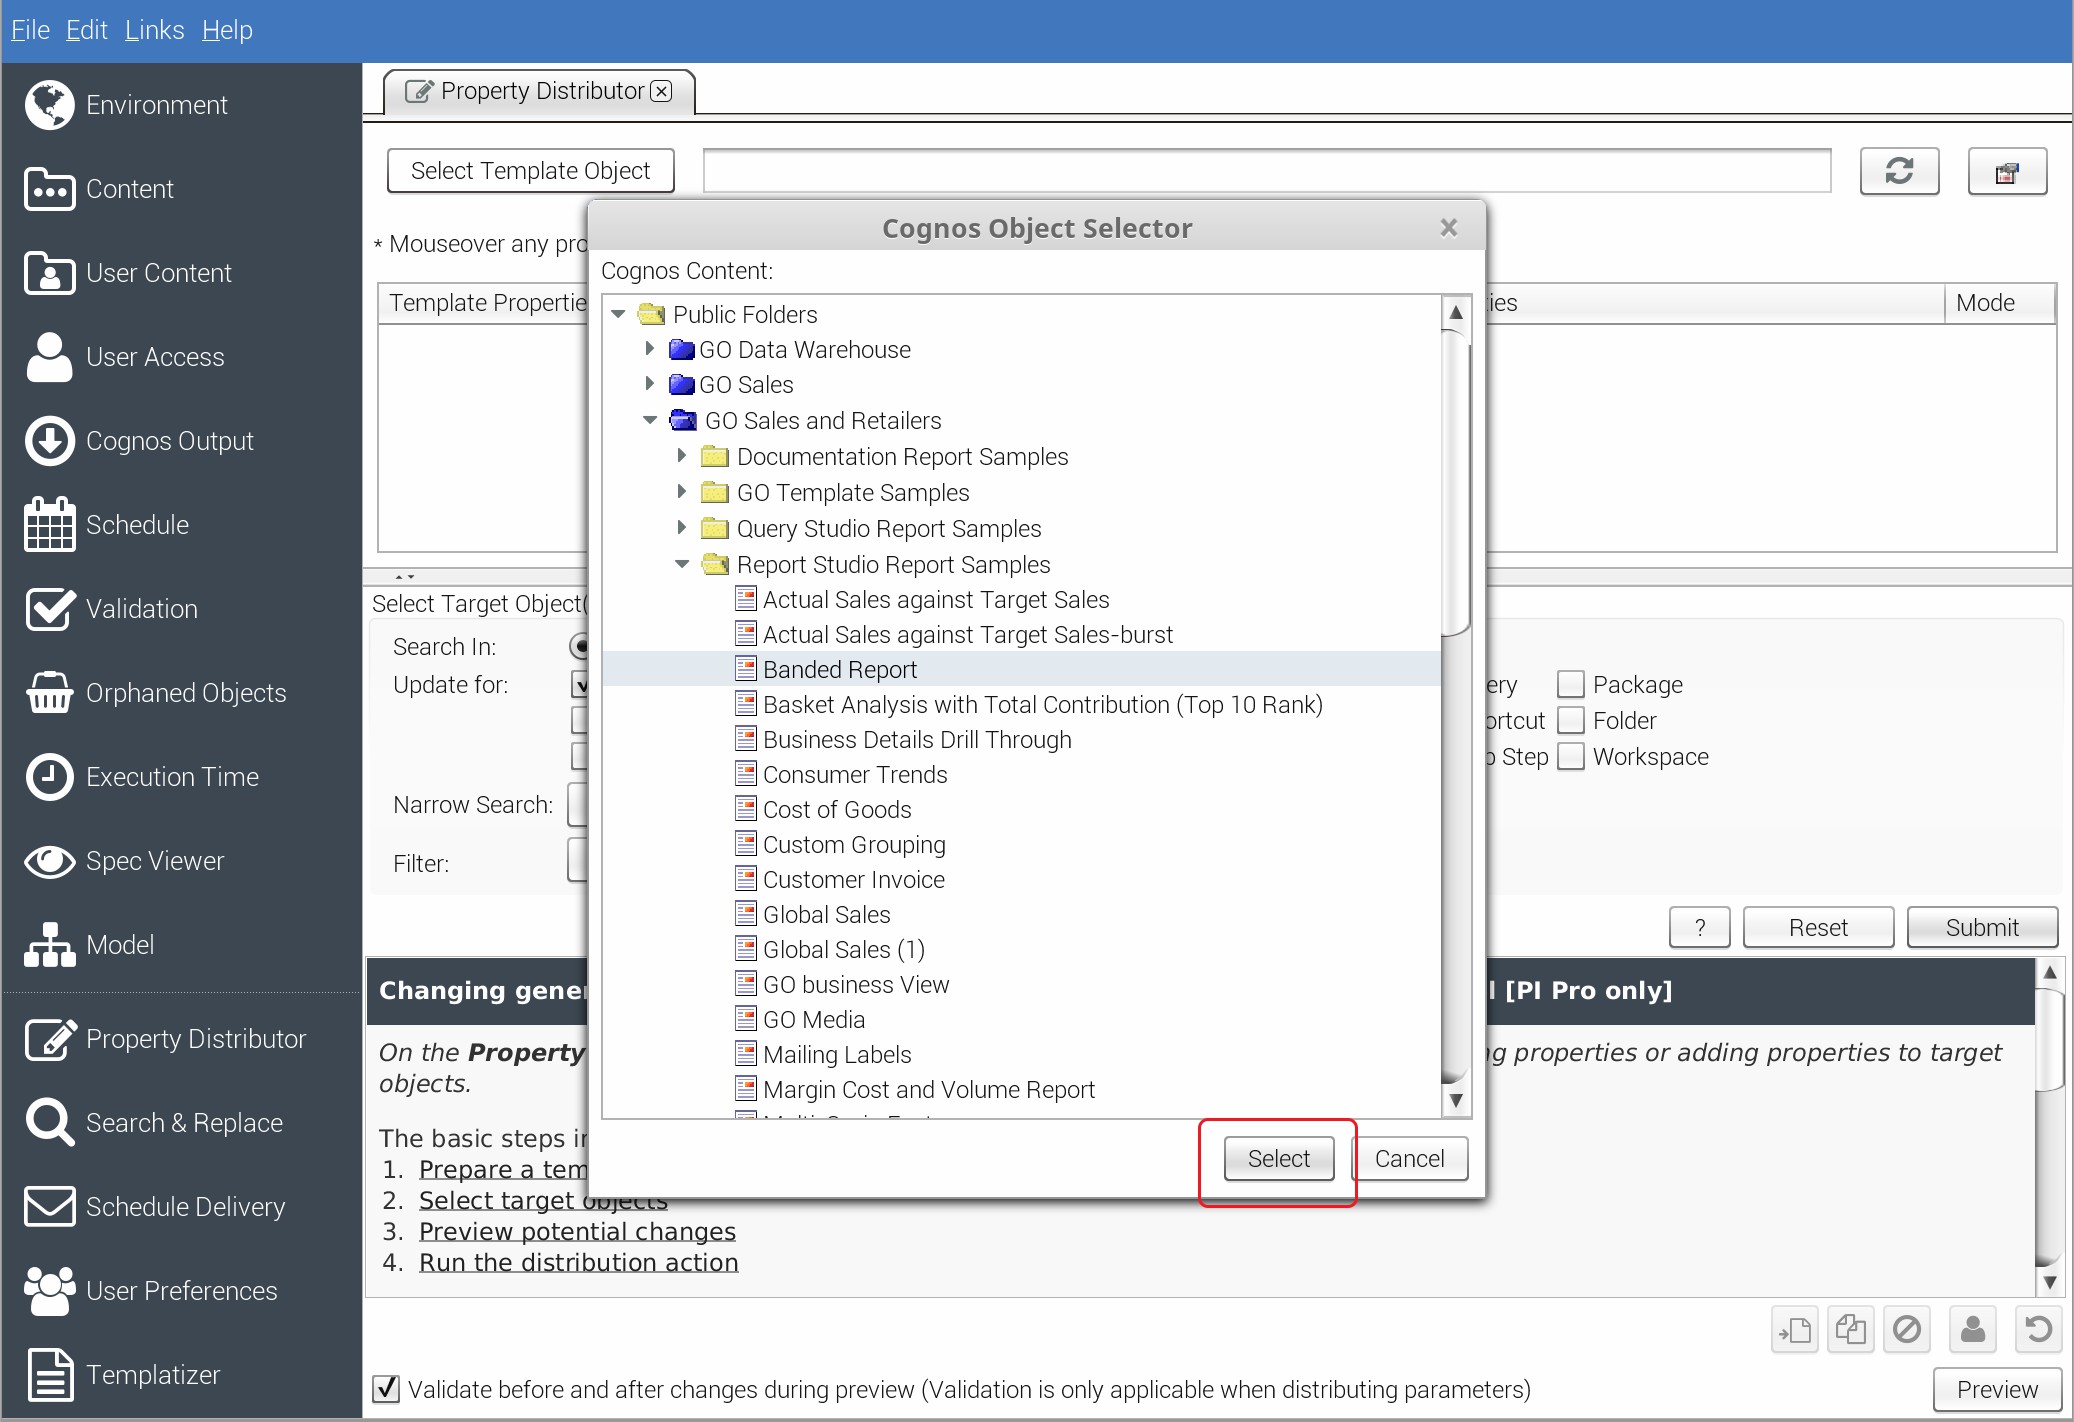
You will now see the Cognos Object Selector window. Use the navigation tree to select the report you configured earlier. Then click the Select button

Click to enlarge

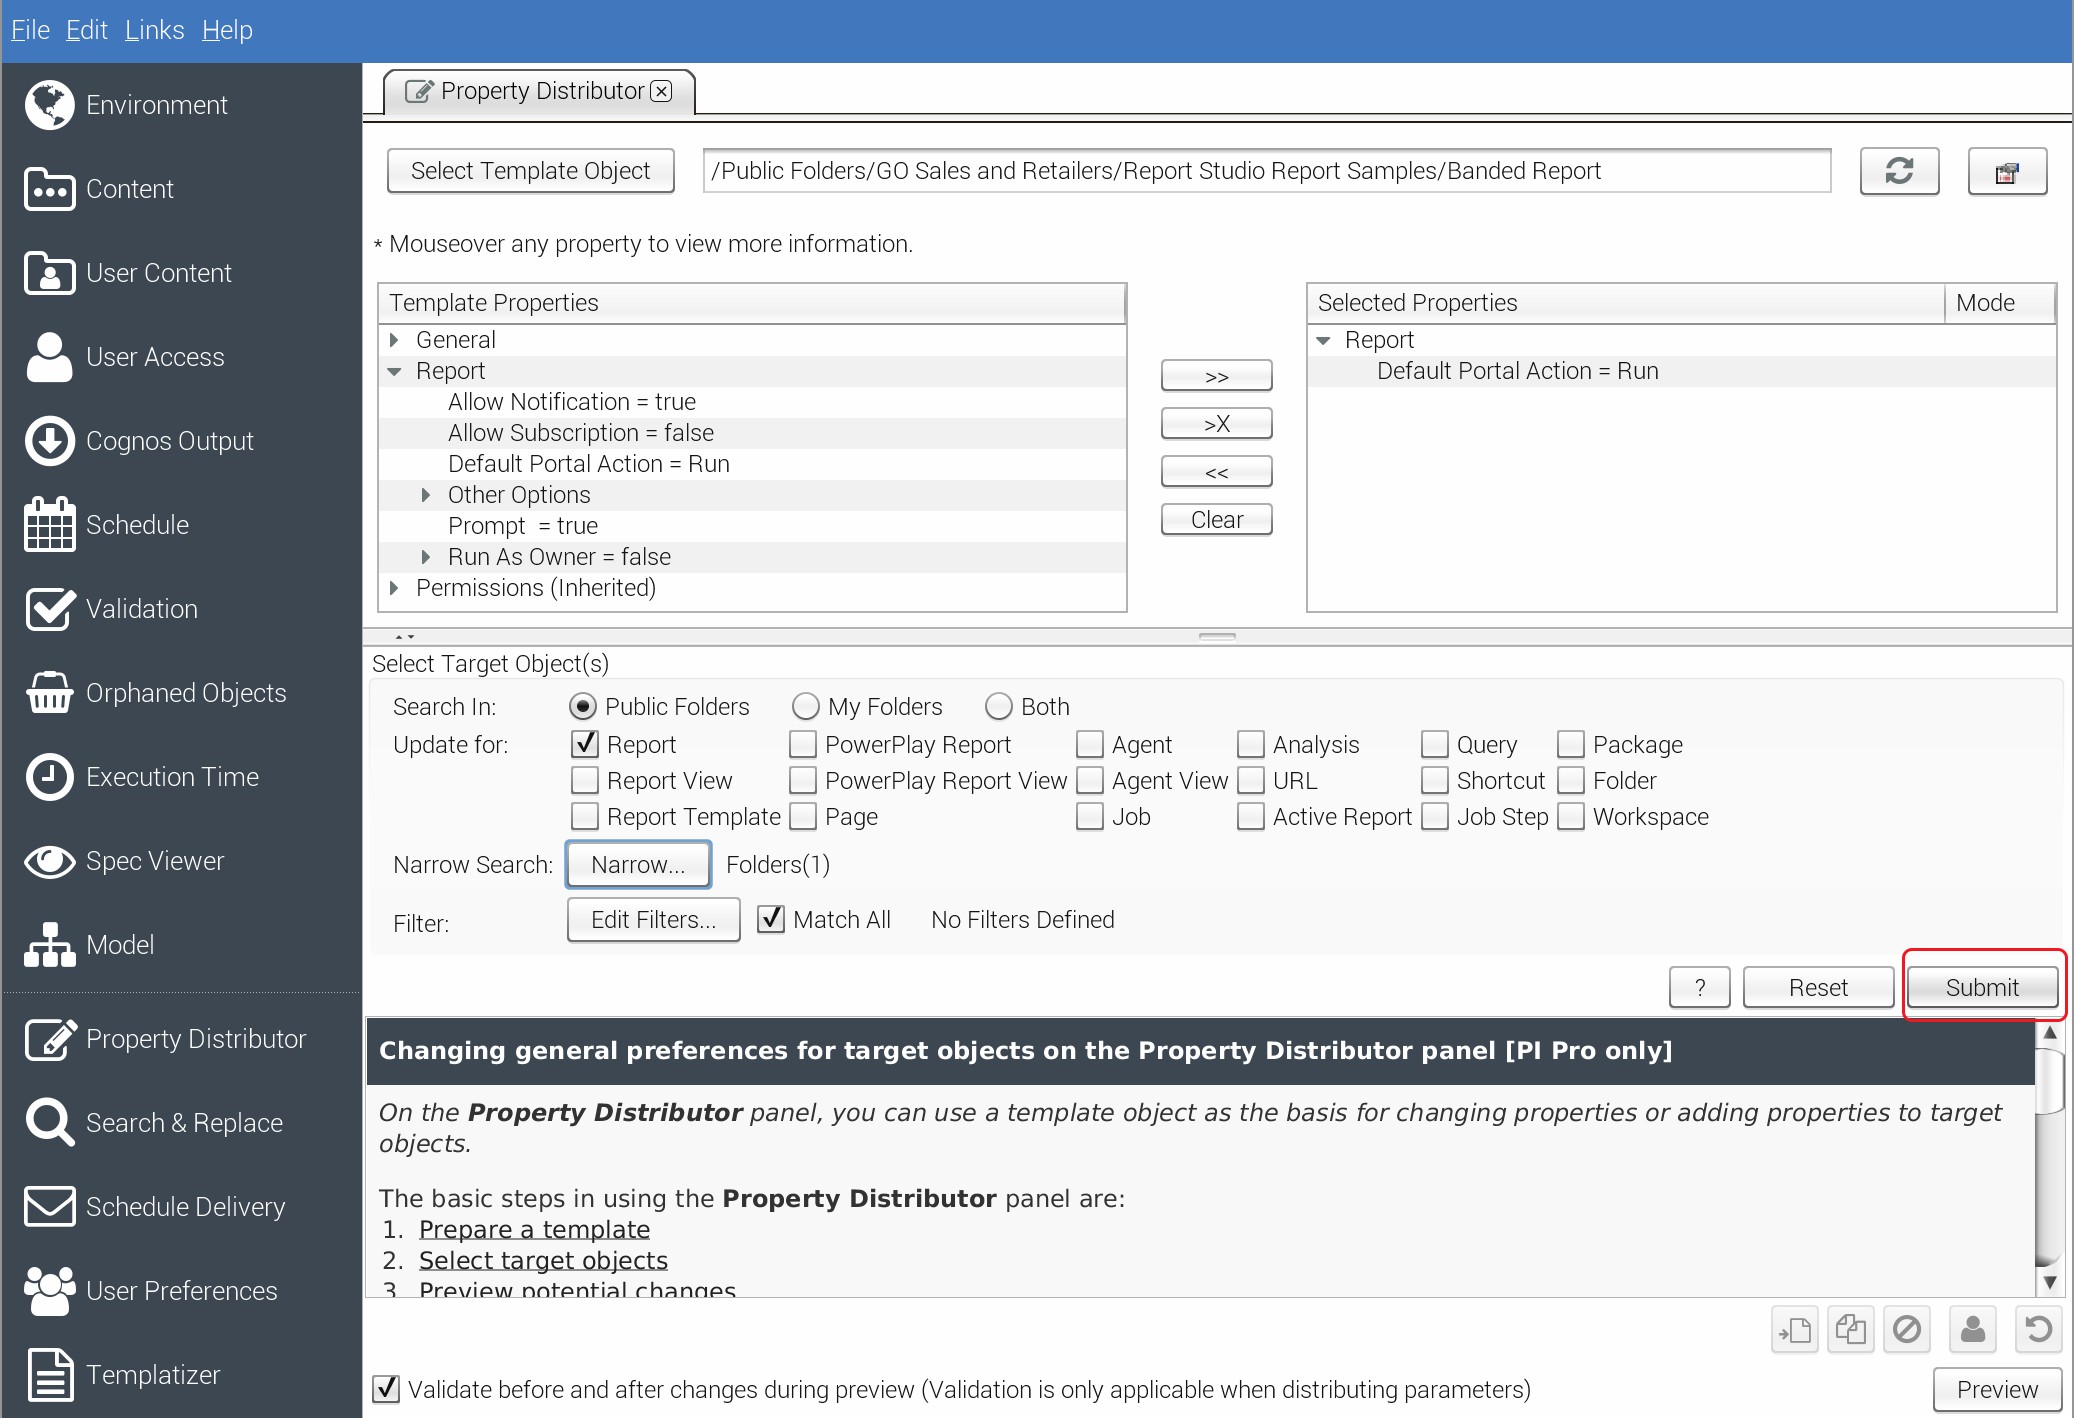
Under the Template Properties, expand the Report section and select the “Default Portal Action = Run” property.
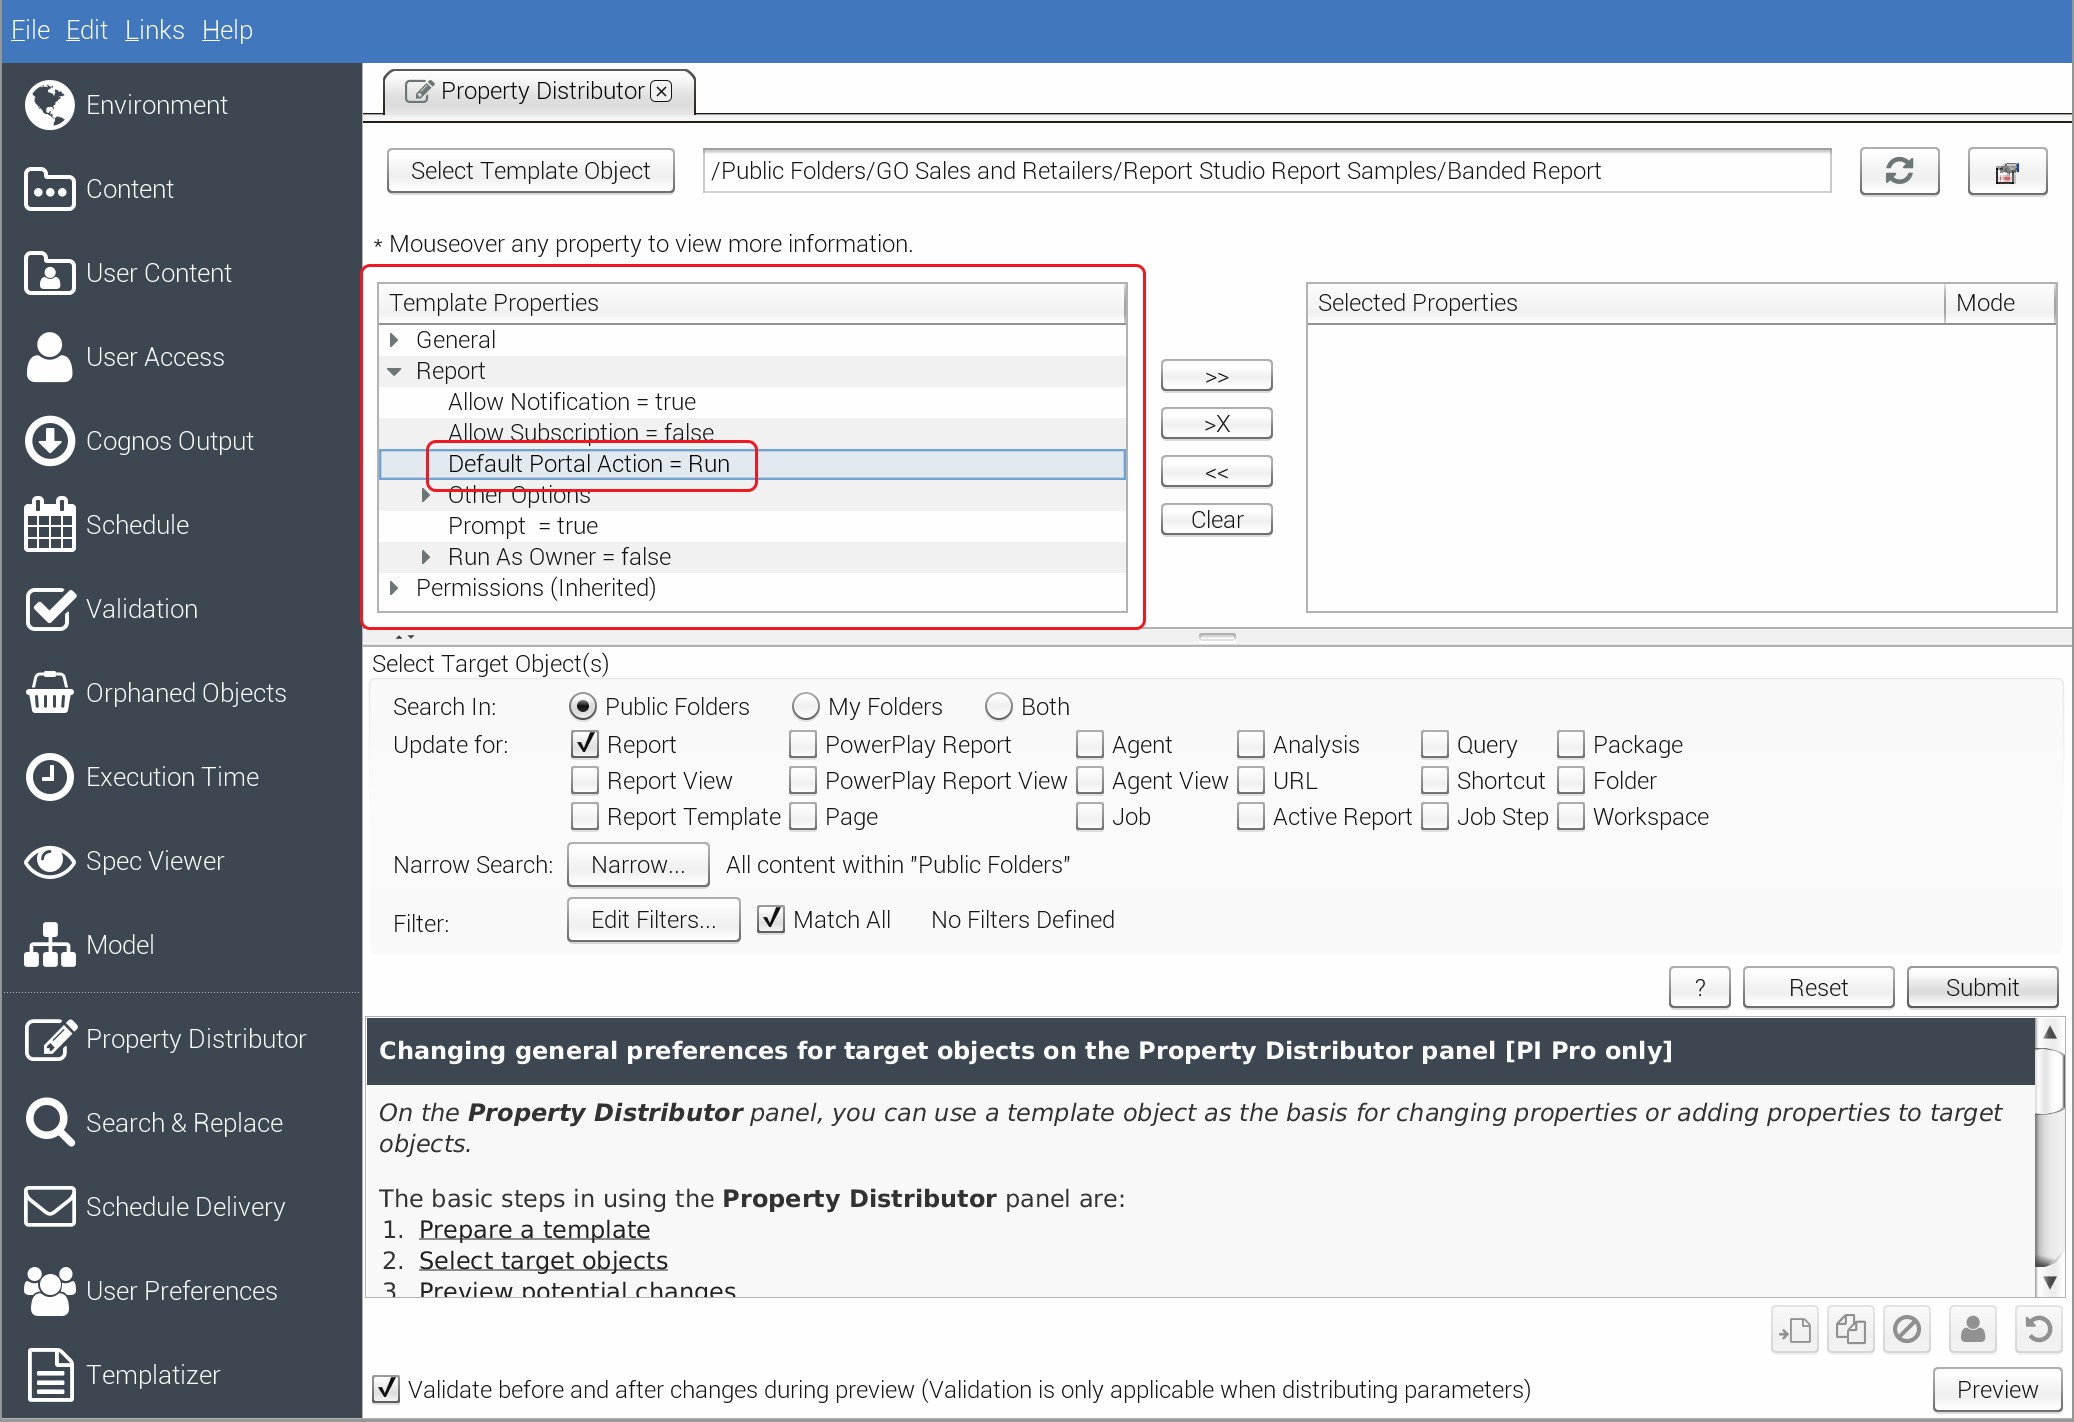
Click to enlarge

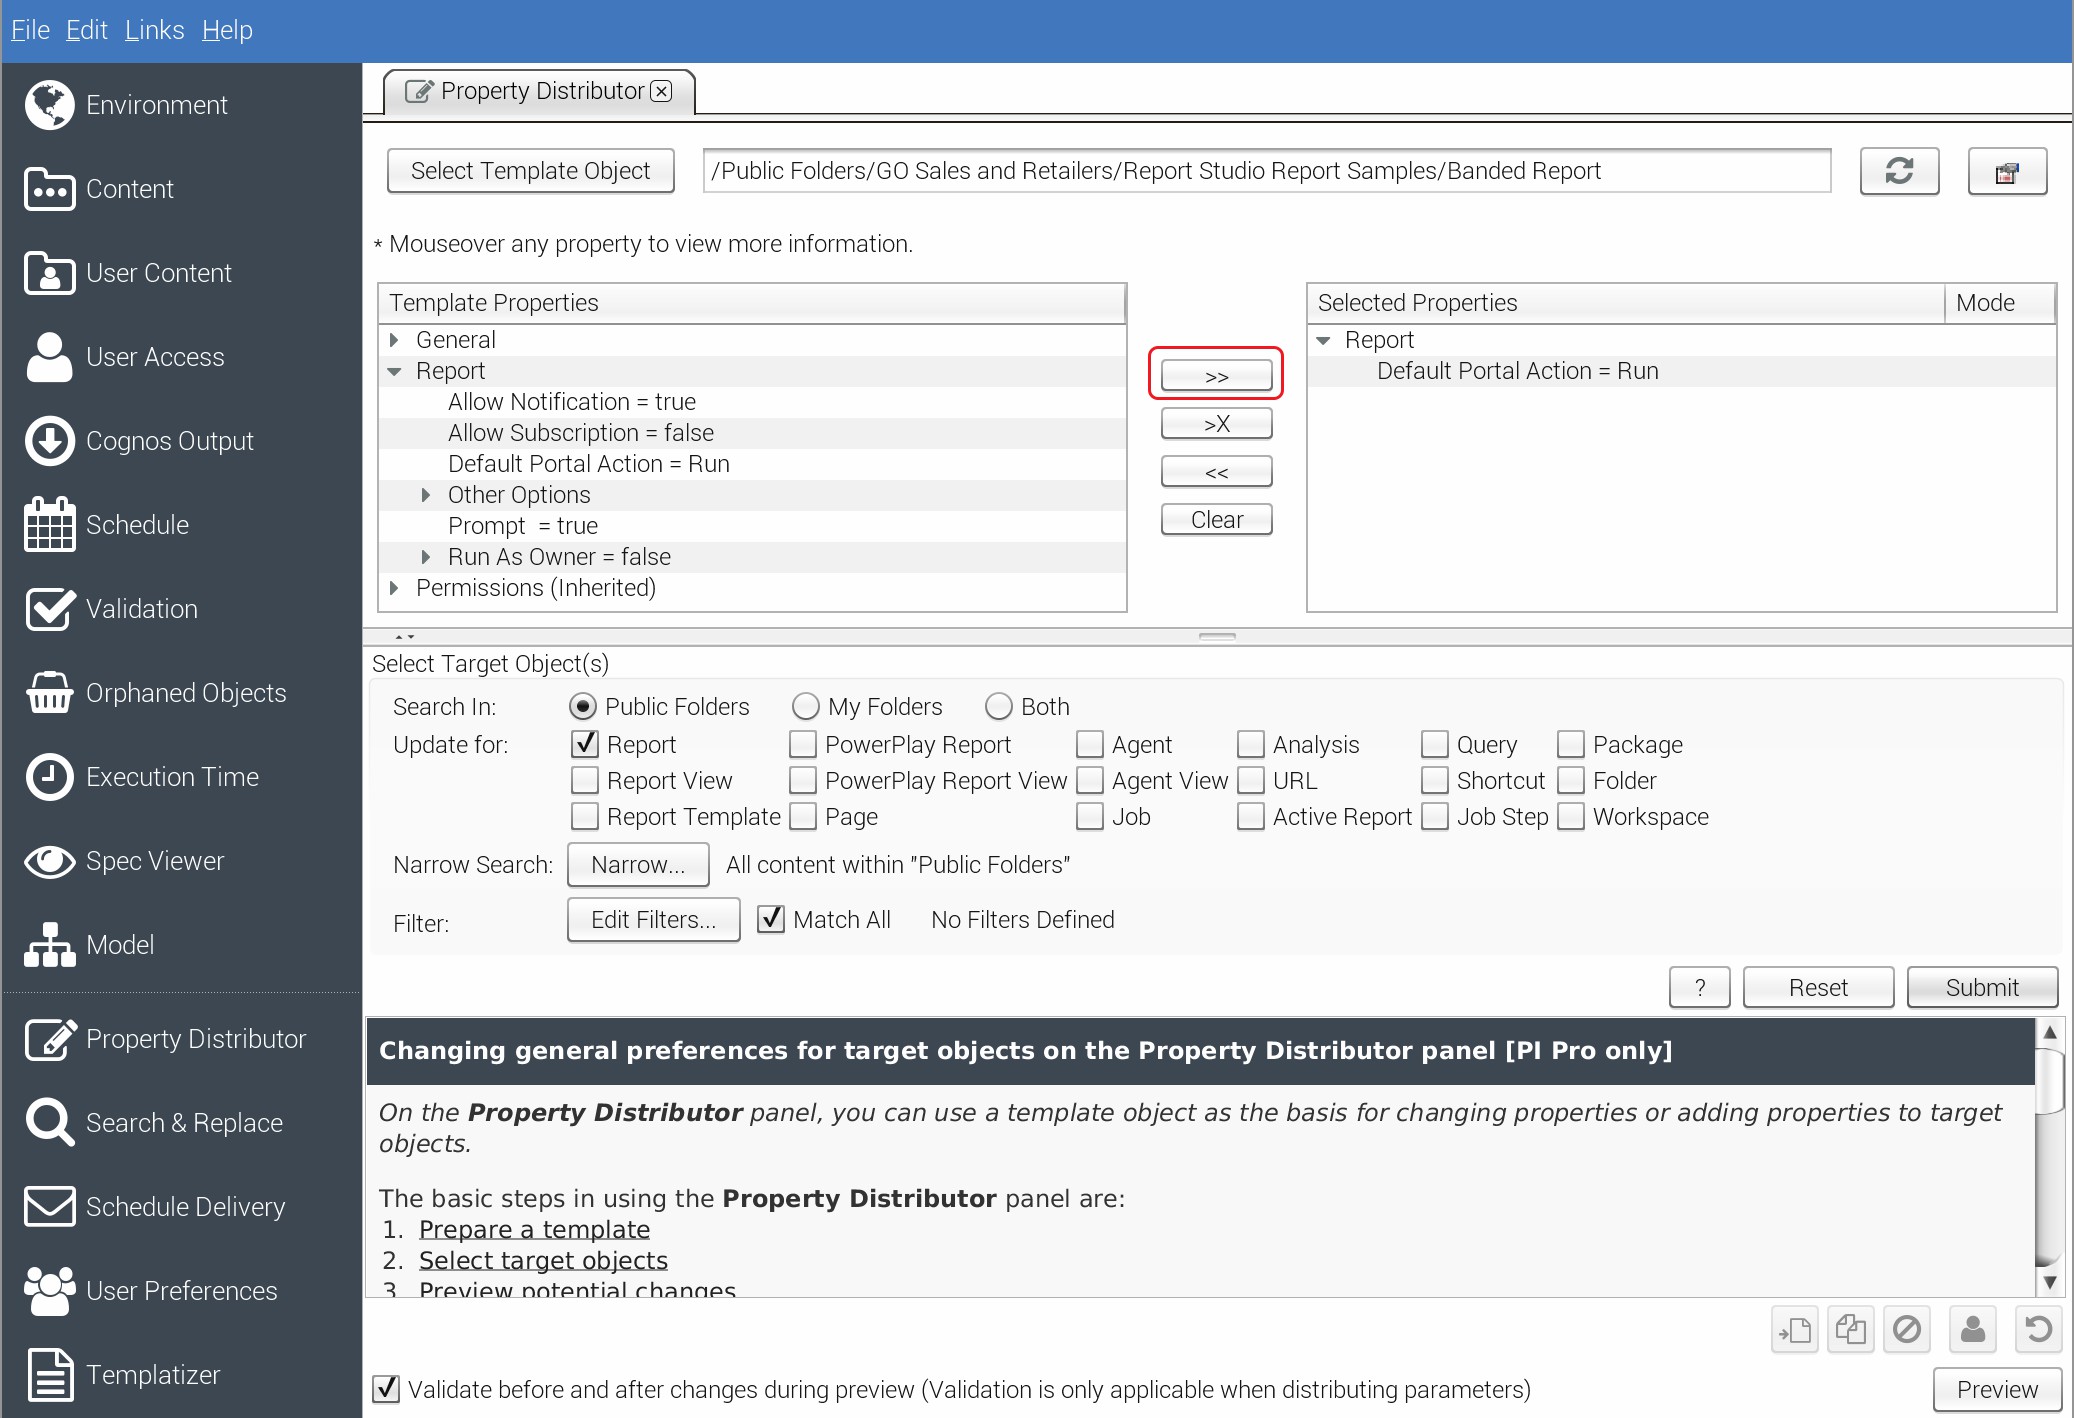
Use the selector arrow to move this property to the Select Properties side.

Click to enlarge

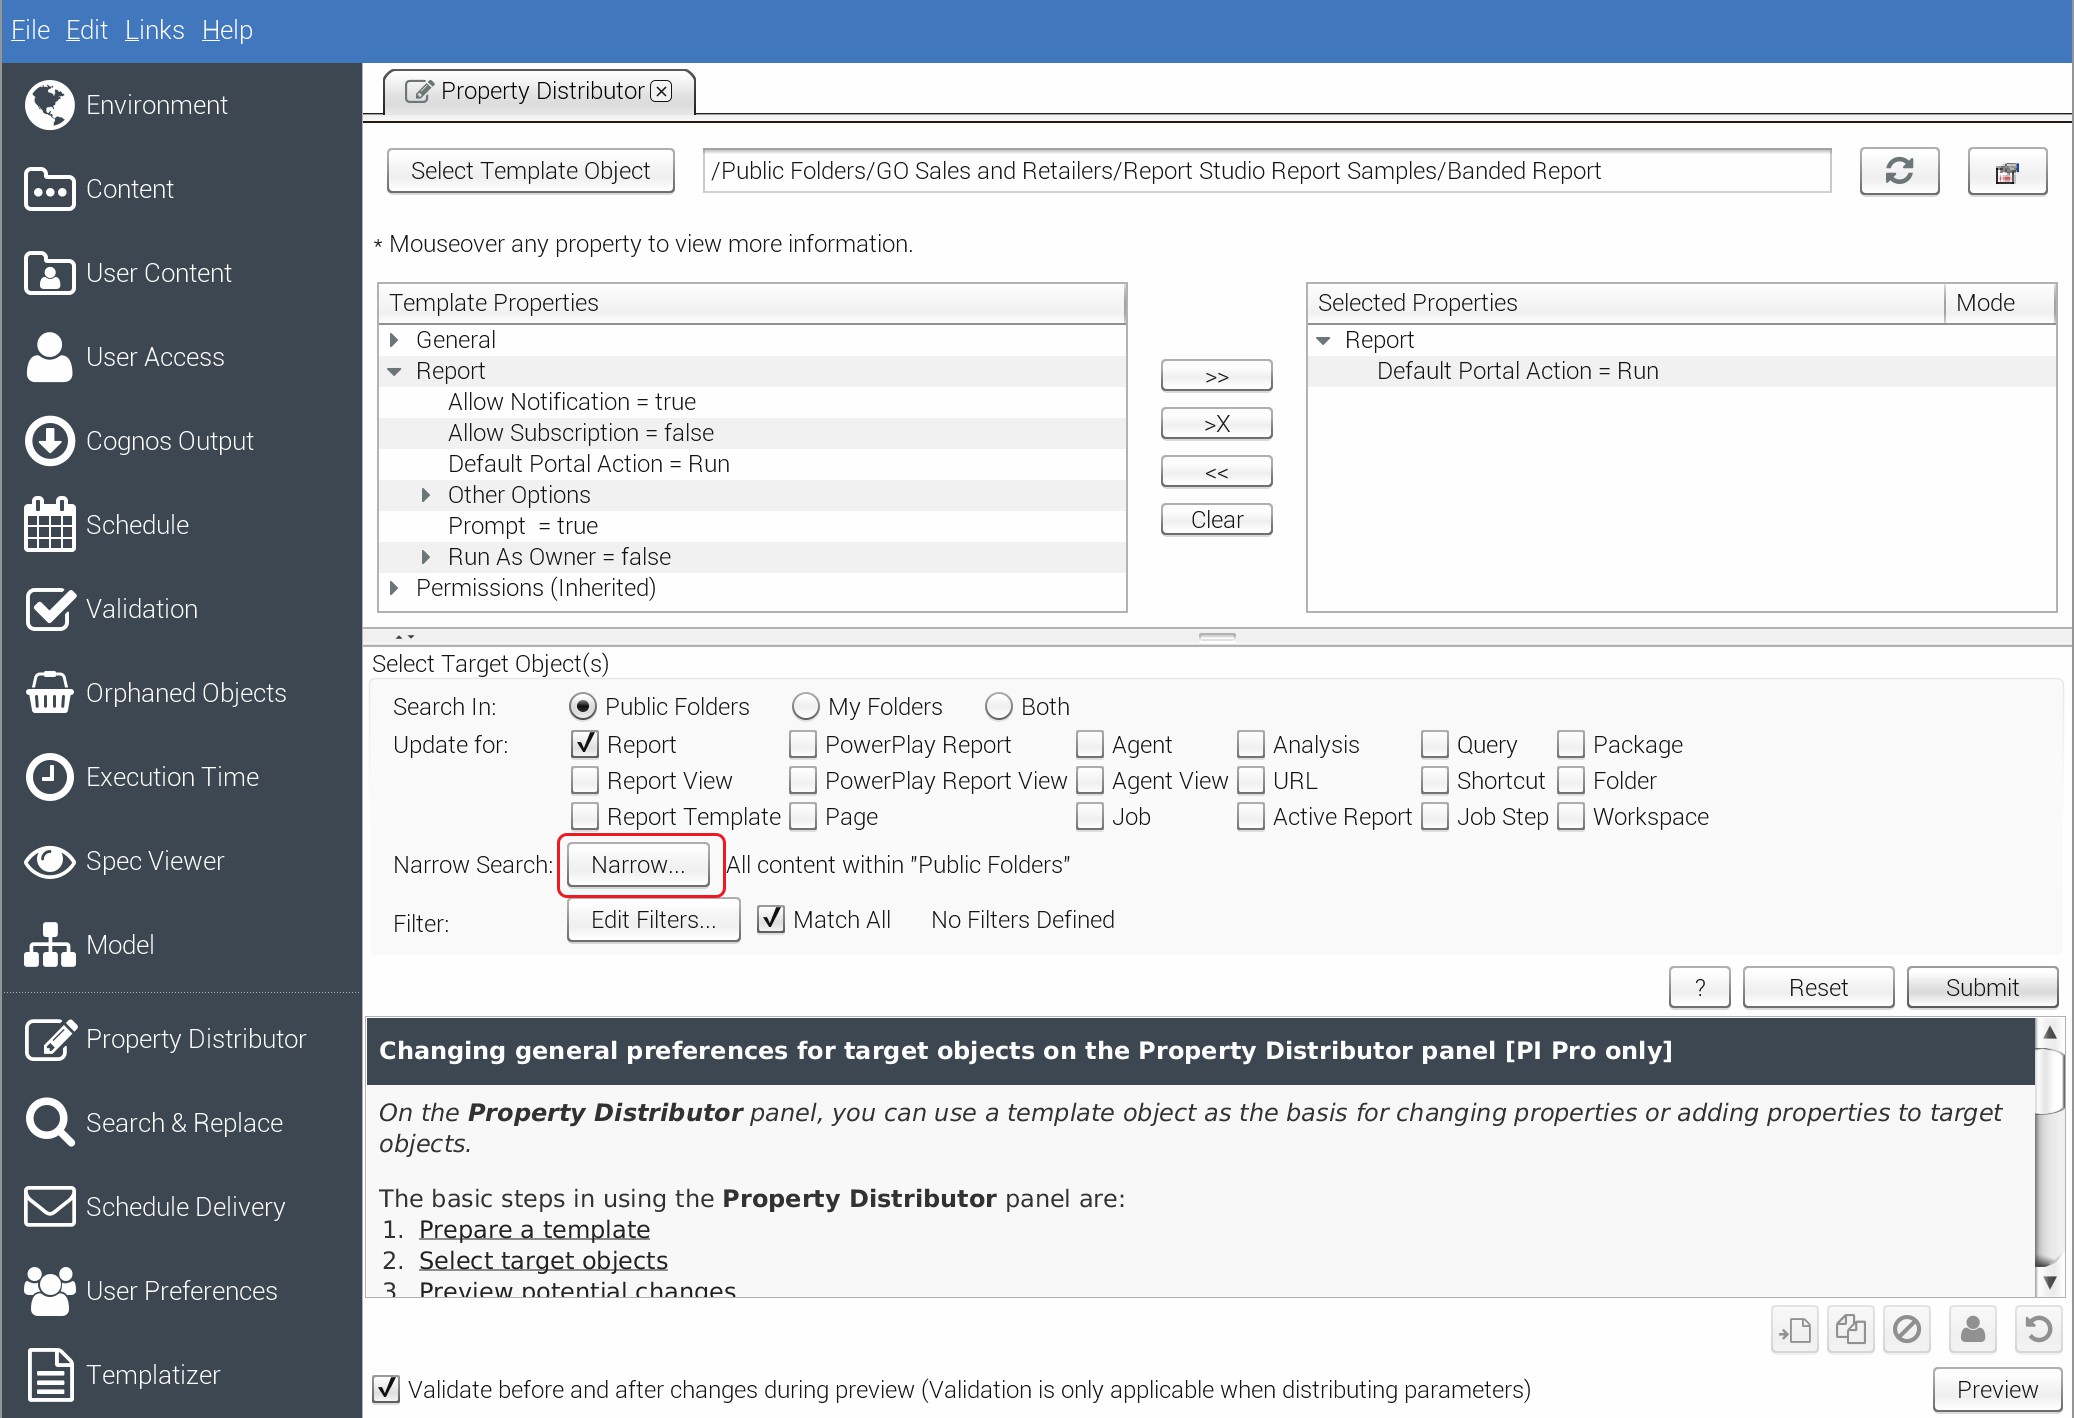
Now we need to tell PI which reports we want to update.In the Select Target Object(s) section, use the Narrow button to select the reports you wish to update.

Click to enlarge

When you click the Narrow button, the “Cognos Object Selector” window will appear. Select the object paths under the Cognos Content section and move them to the “Selected Items” section, then click Apply. In this situation, you are slecting  the entire contents of the Report Studio Report Samples Folder.
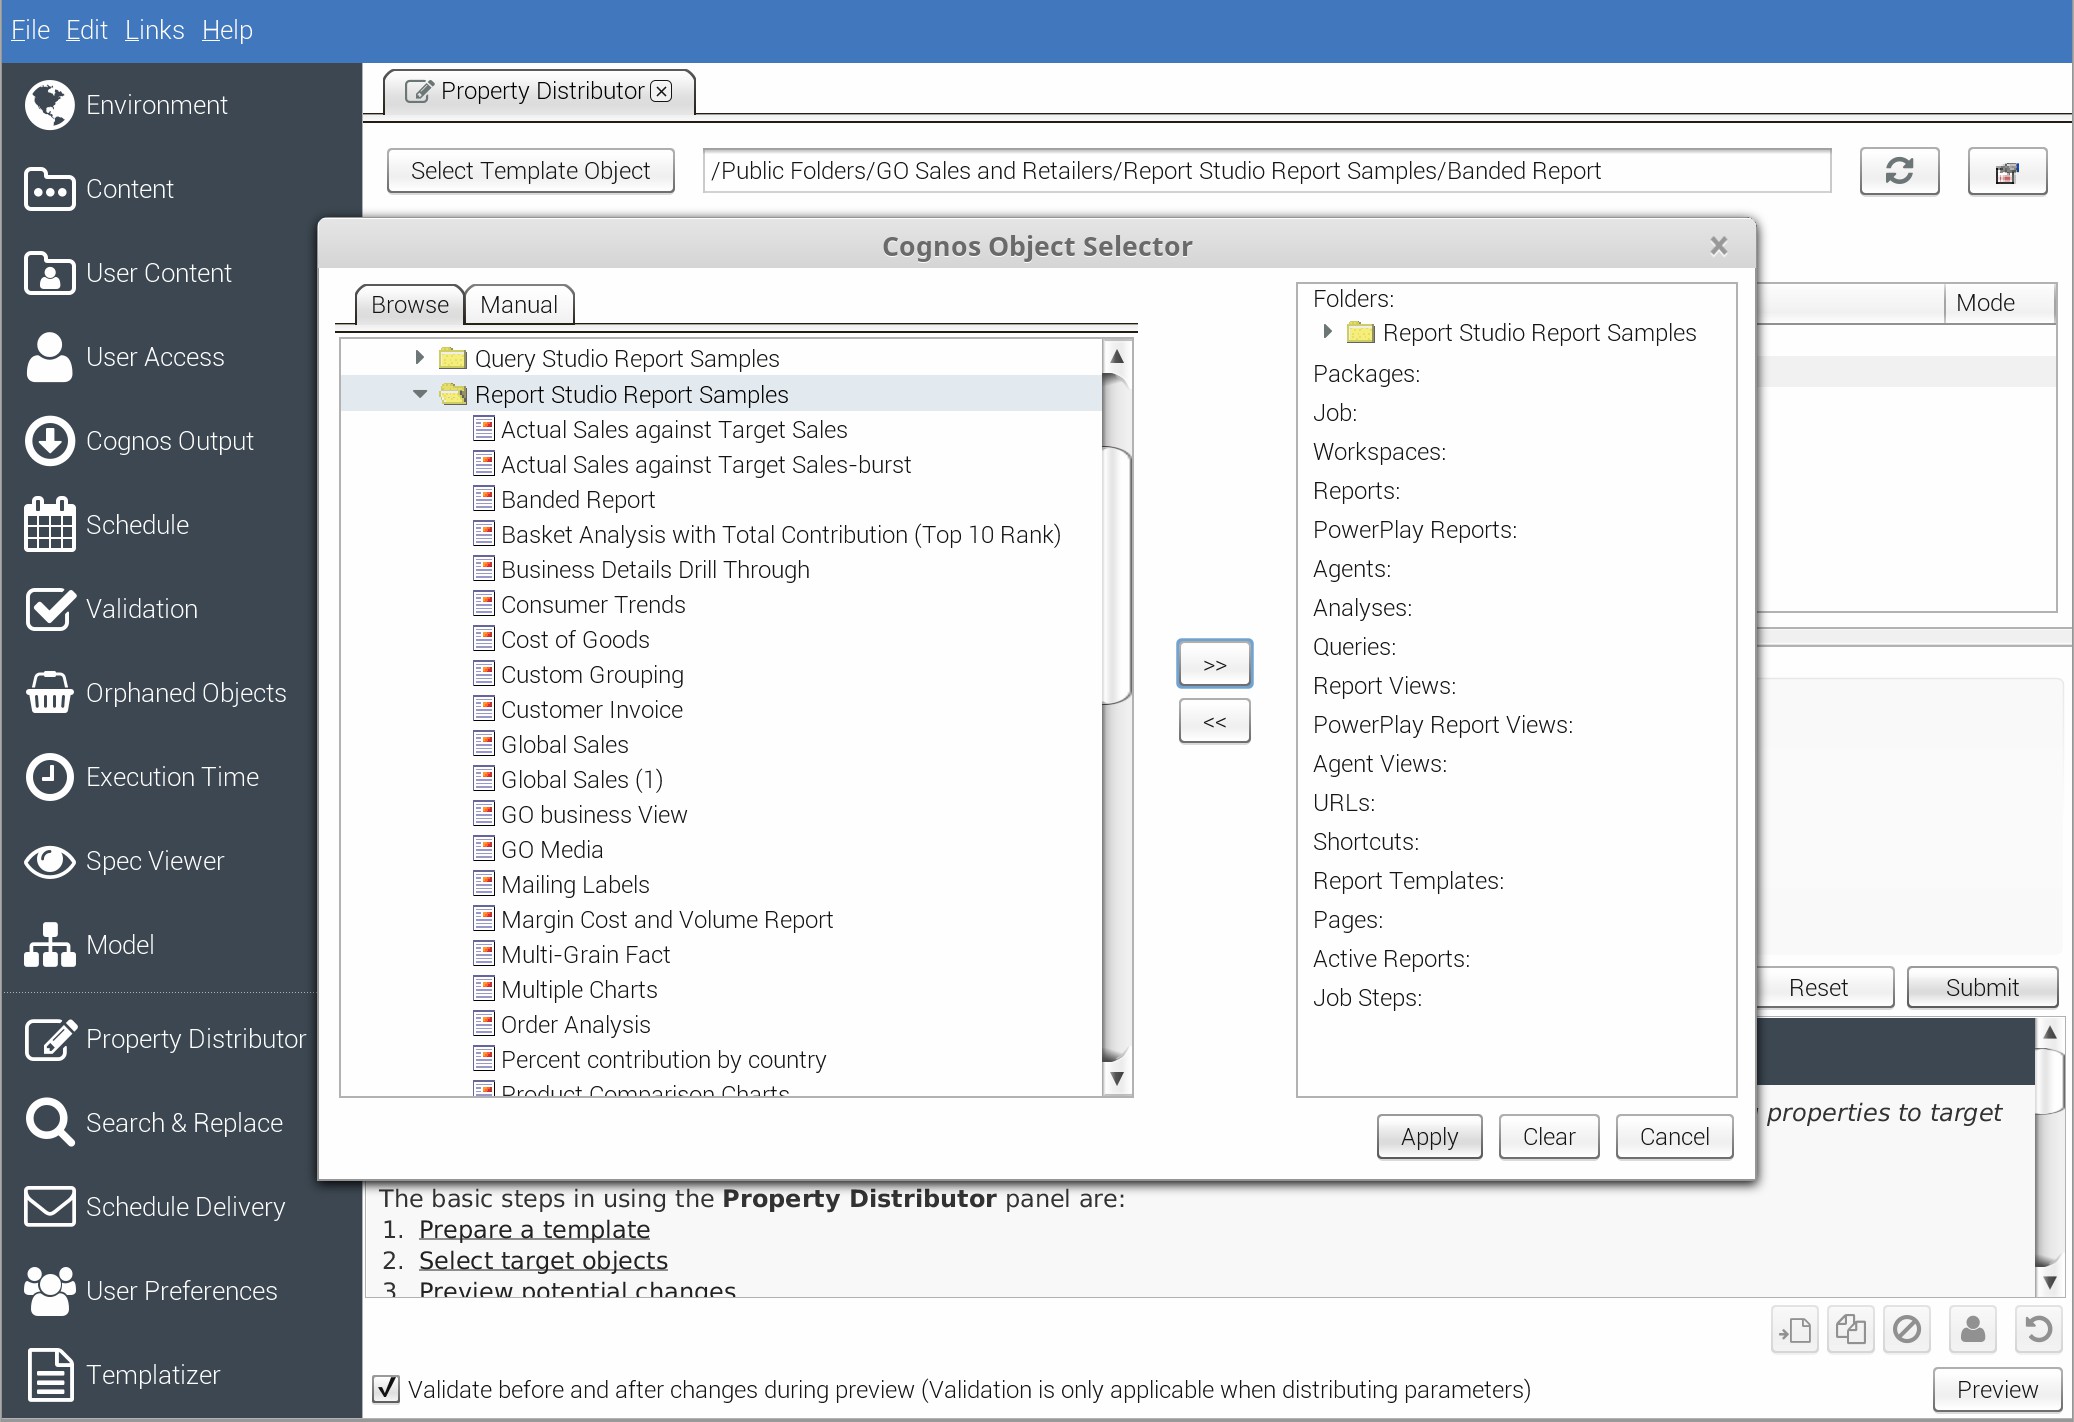
Click to enlarge

Now, click Submit.

NOTE: this will simply query for all the reports which are going to be updated (no updates will be applied yet).

Click to enlarge

The query will begin to return results in the bottom section. When the query has completed you will see a full list of the reports found.
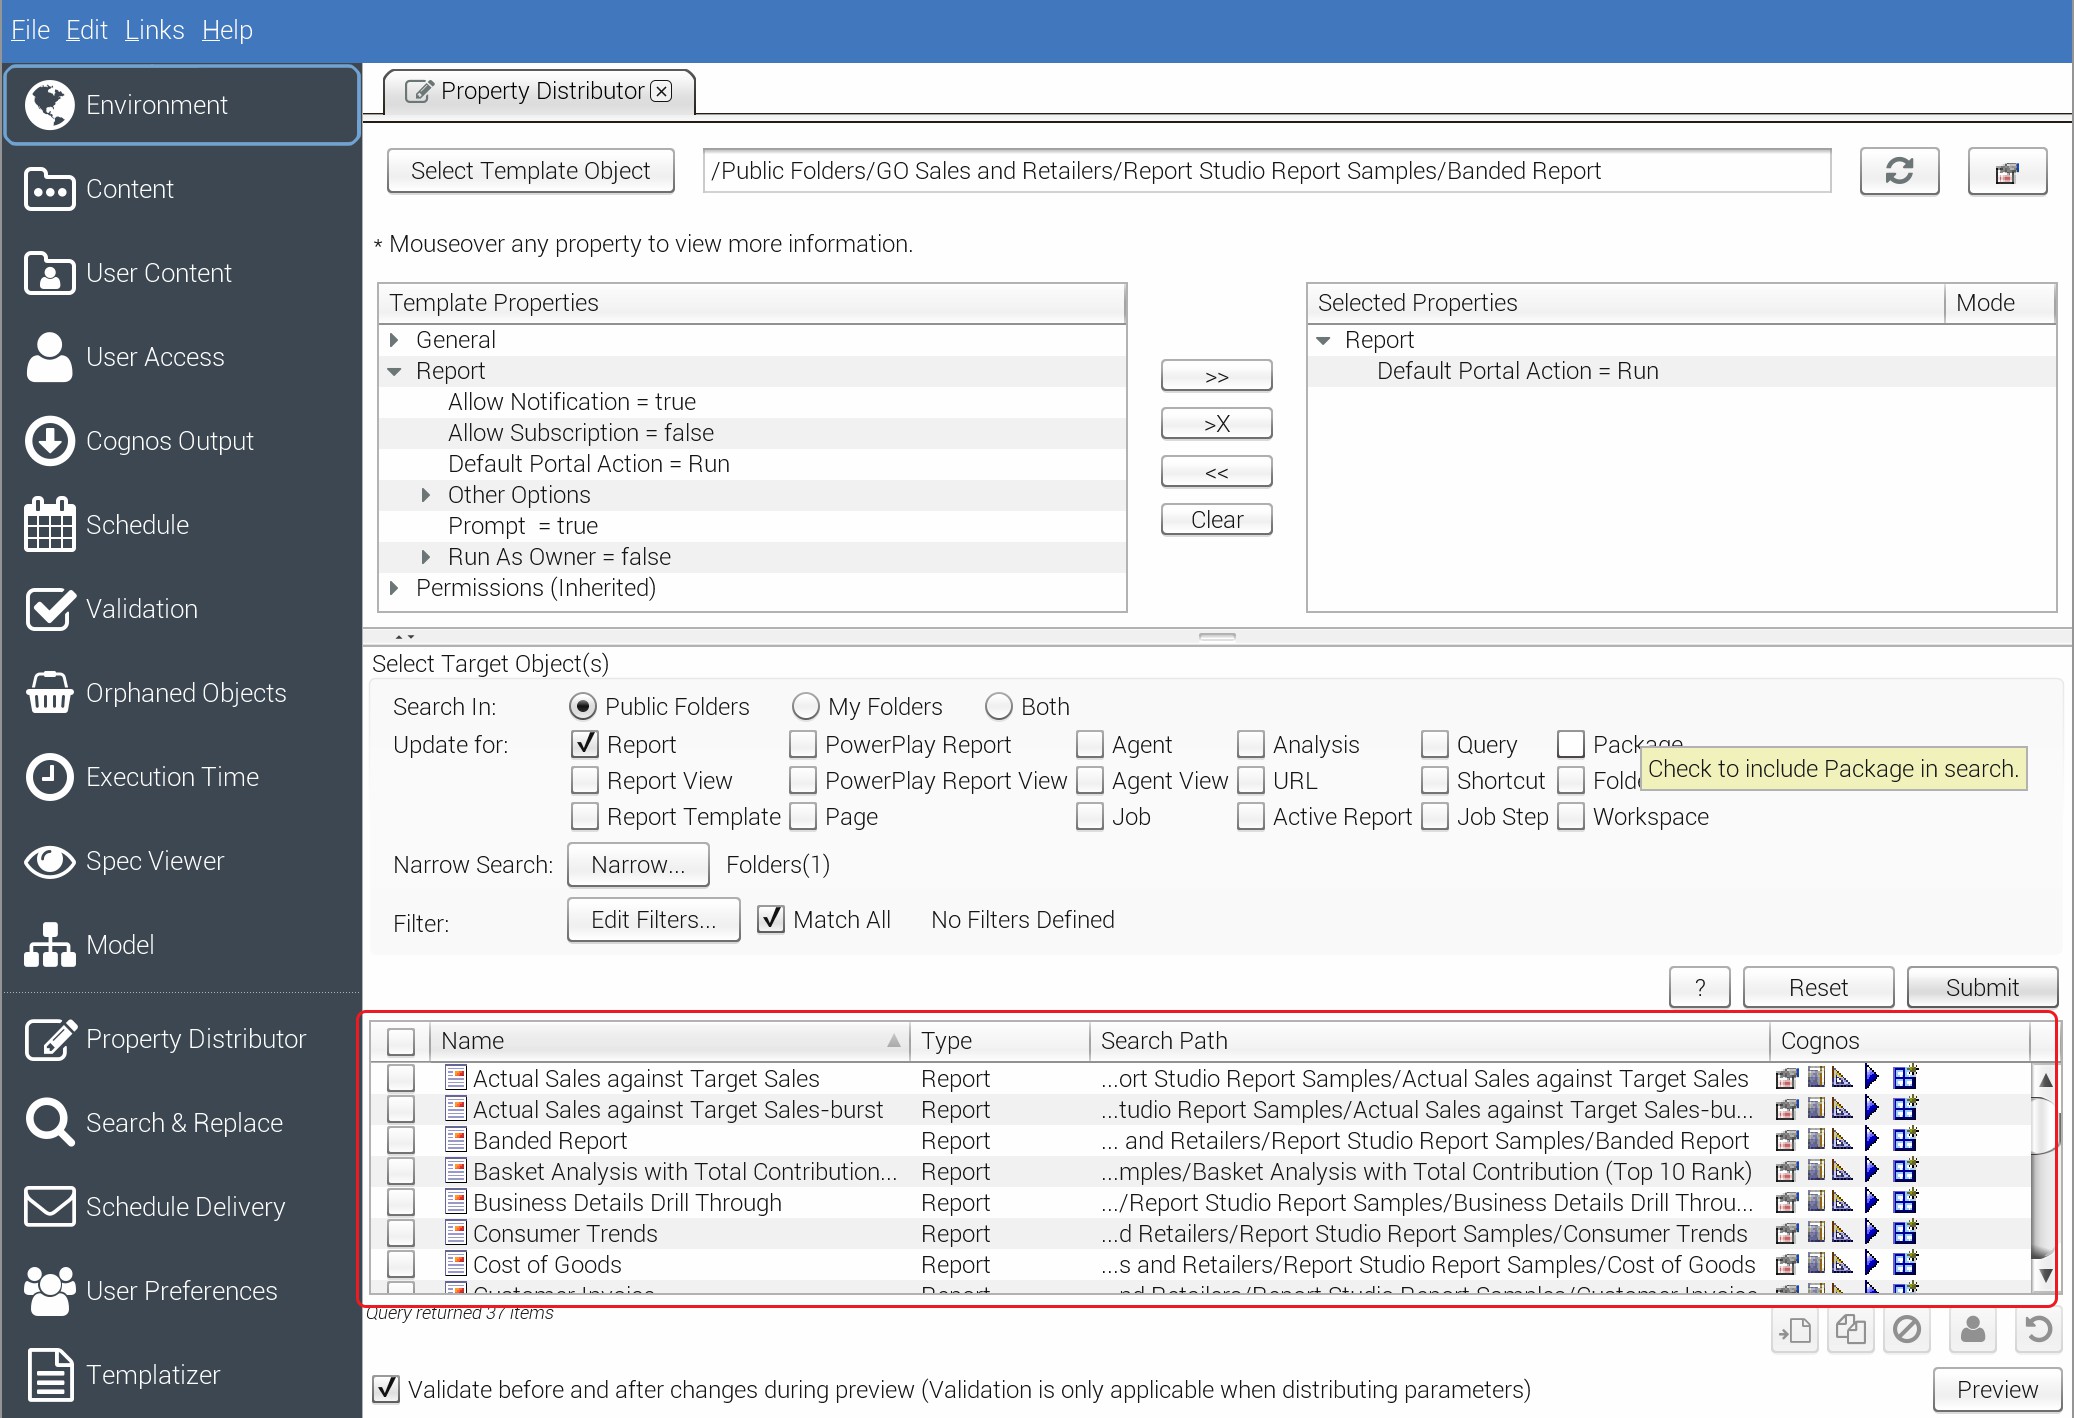
Click to enlarge

Now, to select all the Reports in the list to update, click the select all check box.
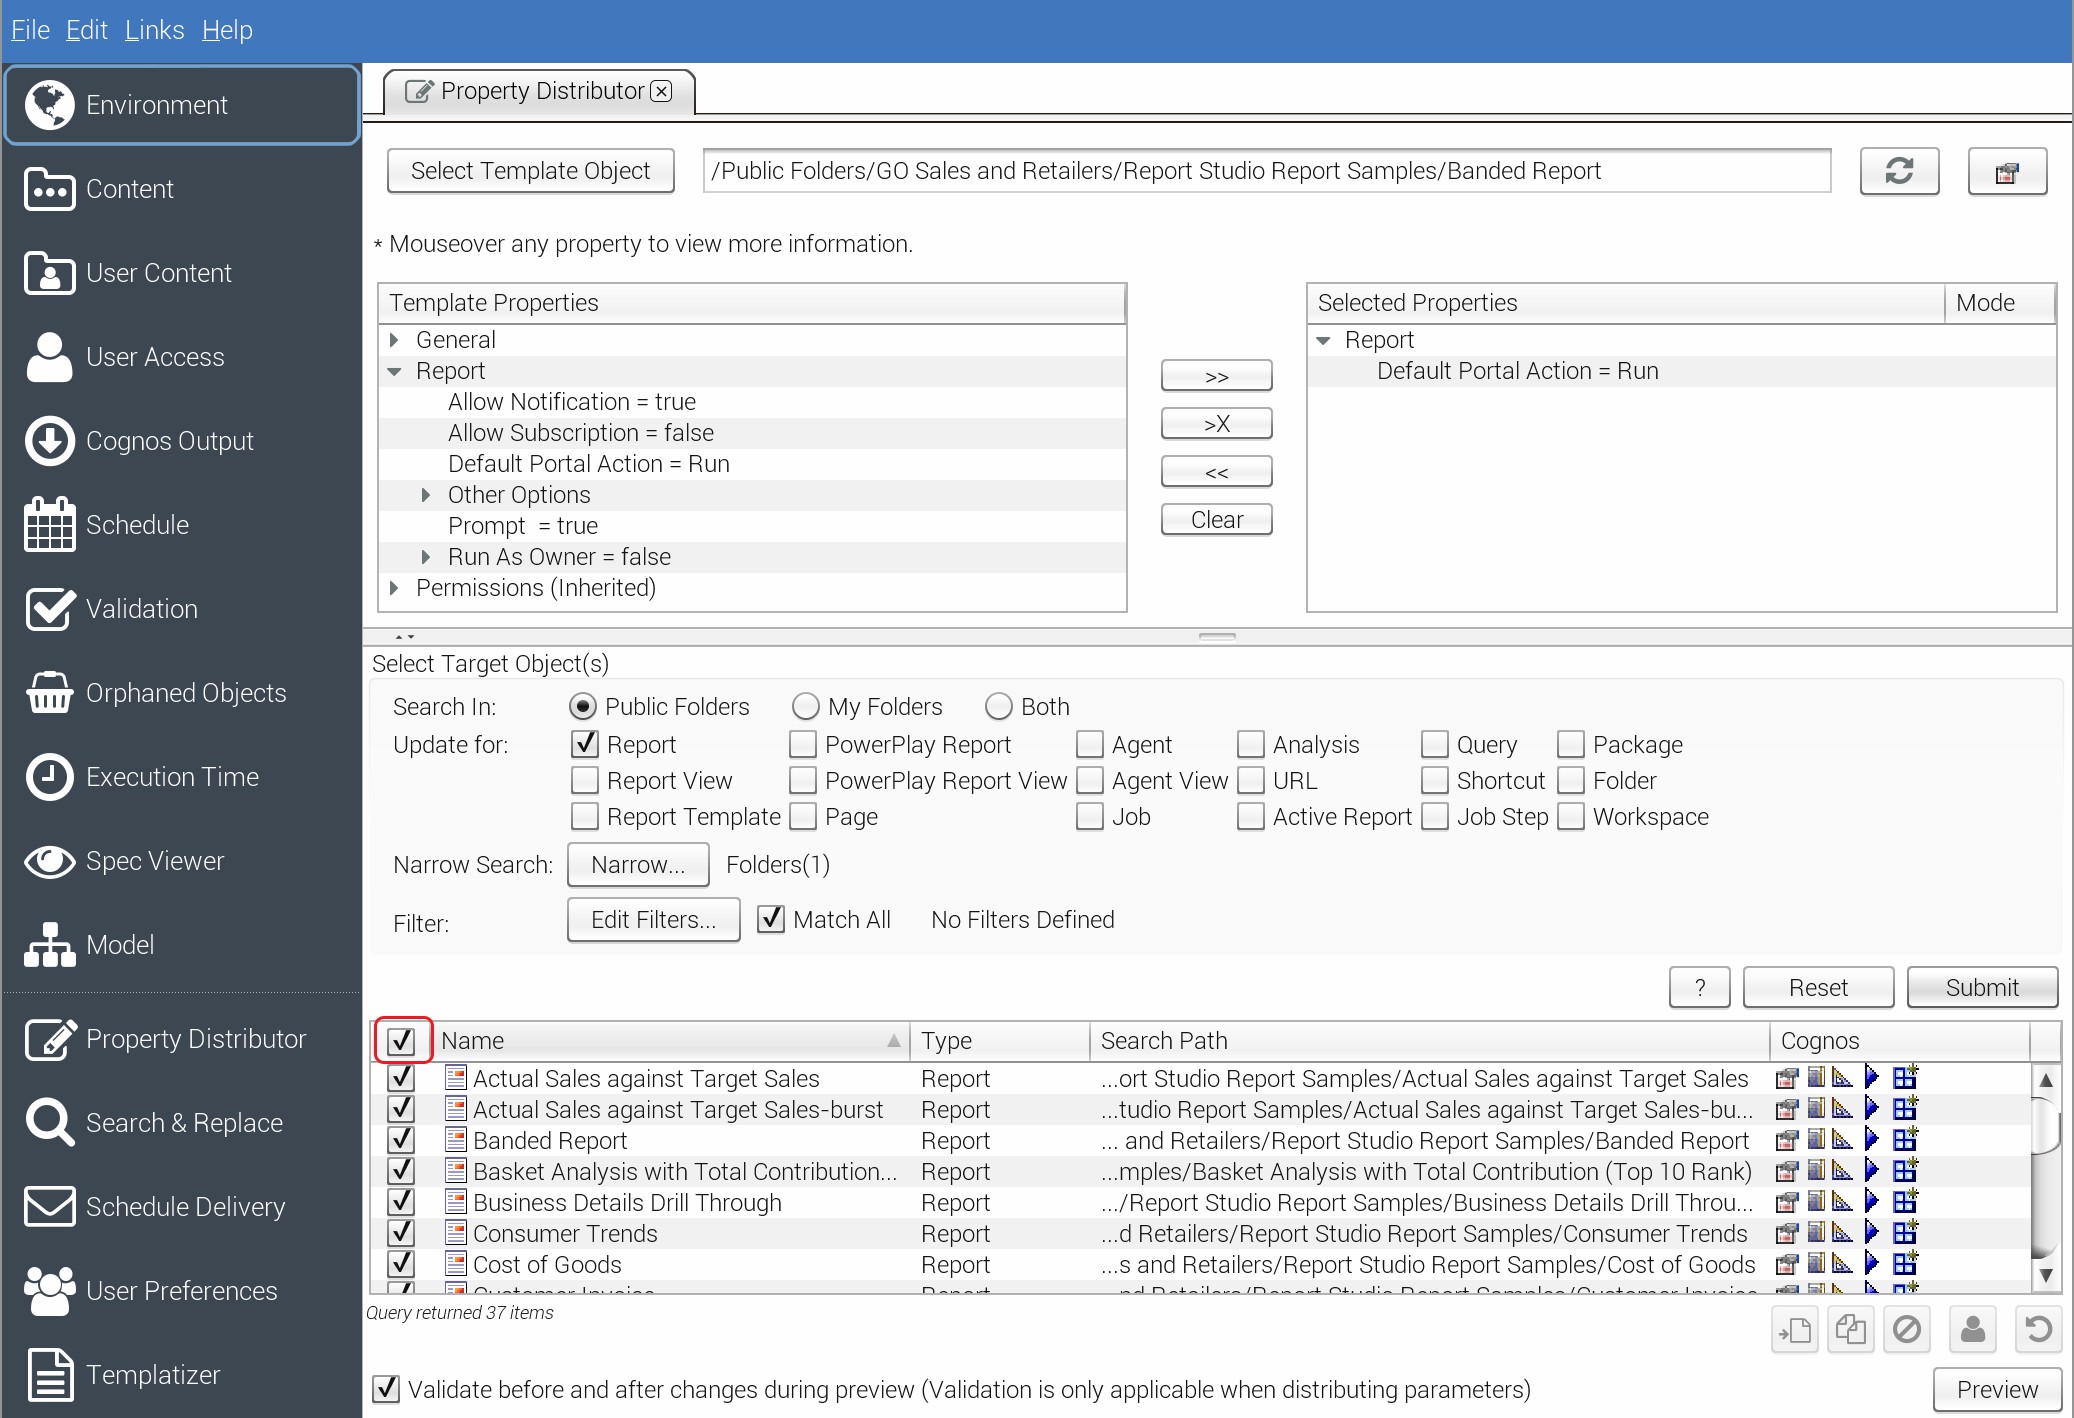
Click to enlarge

To preview the changes that will be made, click the Preview button at the bottom of the panel. You will now see the Property Distributor Preview windnow. If you select one of the reports you will see the Old Properties (on the left) and New Properties (on the right).

Any pending changes will be shown in blue.
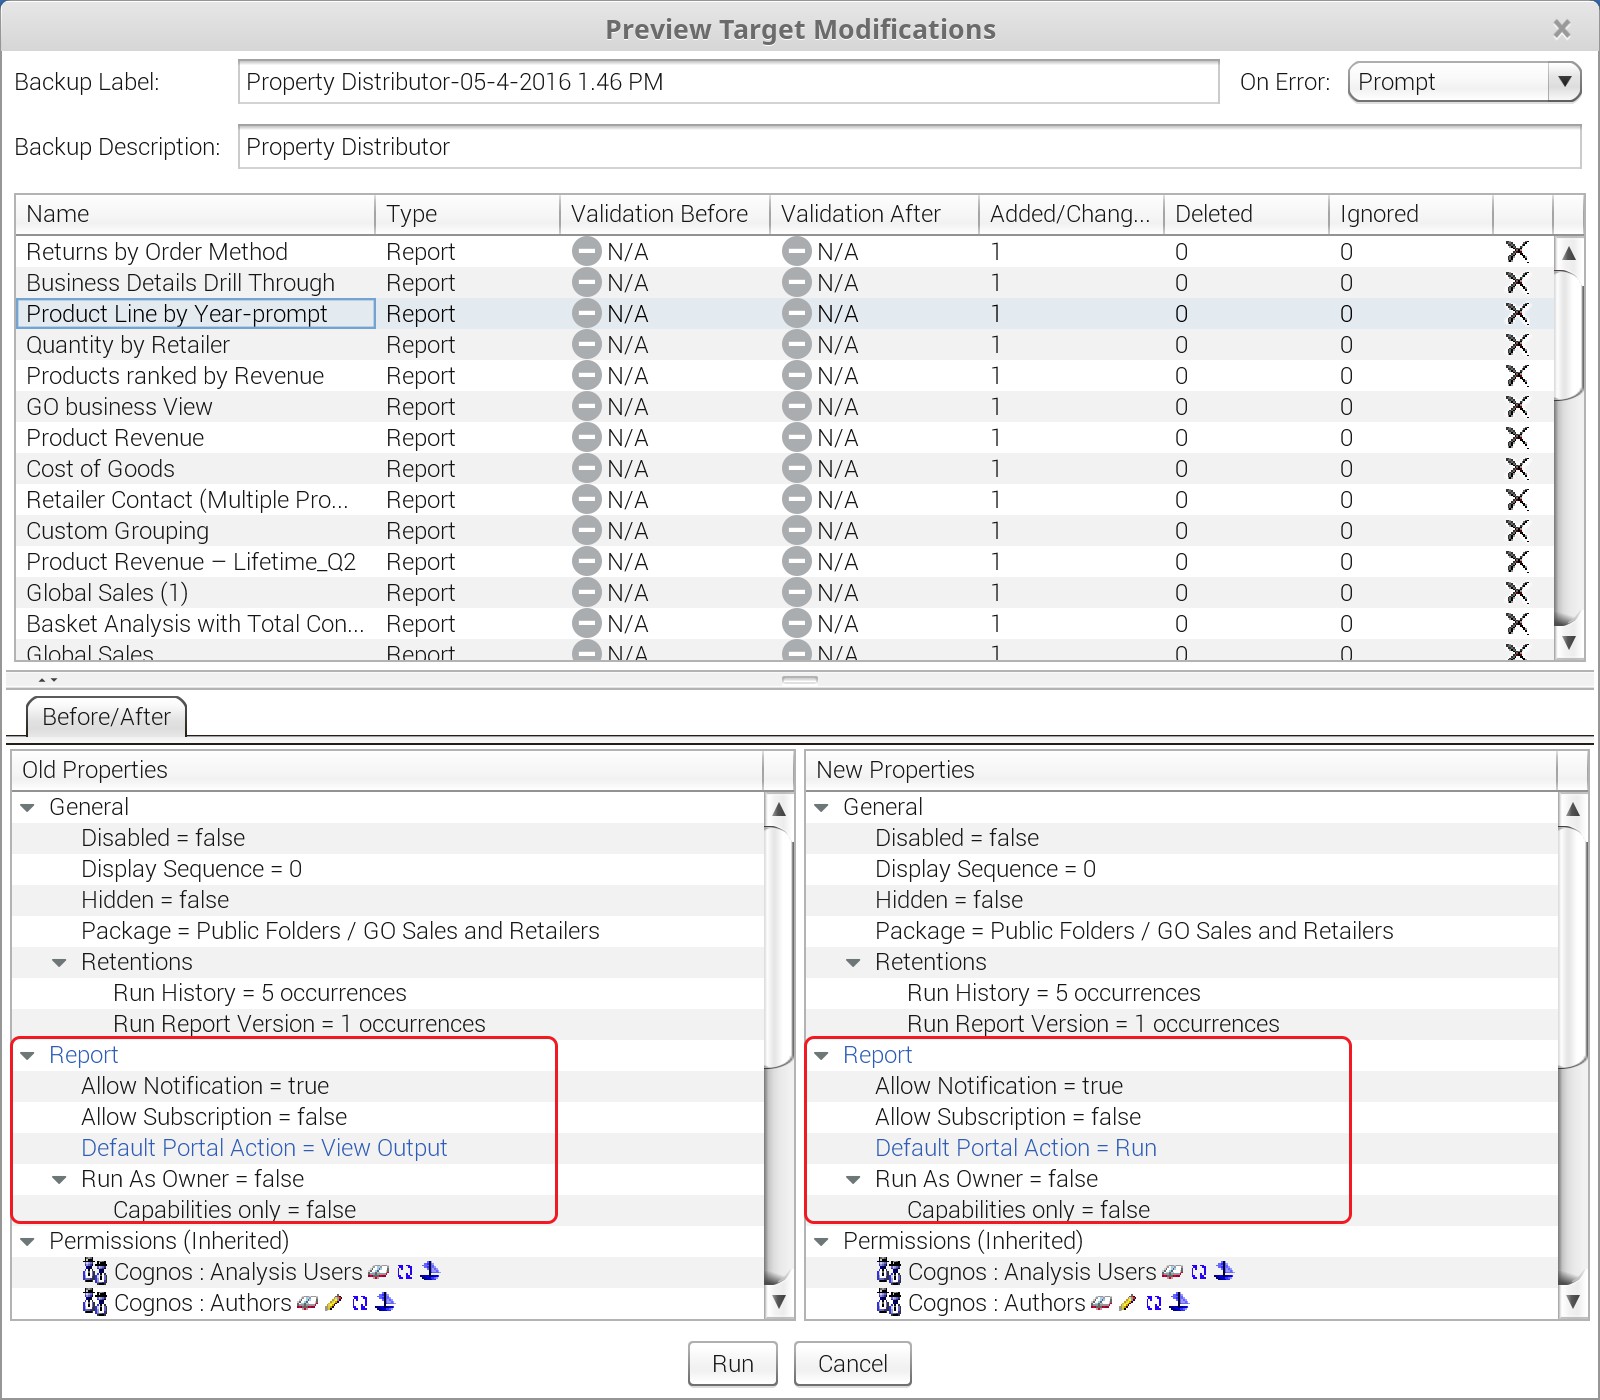
Click to enlarge

You can now click Run to apply the property update to each of the selected reports.

Once all the changes have been made, you will get a message box confirming the completion and informing you that backups were made.

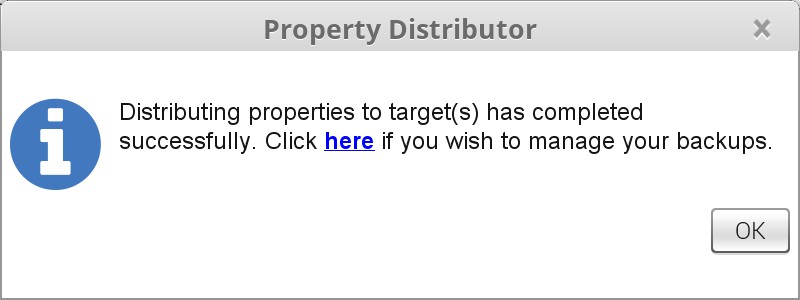
Click OK, and now you can go back into Cognos Connection and confim that the changes were made by looking at the properties of various reports.

{{cta(‘906002cf-92bf-4dd3-b6b7-9e2e26591a50’)}}

Scroll to Top
As the BI space evolves, organizations must take into account the bottom line of amassing analytics assets.
The more assets you have, the greater the cost to your business. There are the hard costs of keeping redundant assets, i.e., cloud or server capacity. Accumulating multiple versions of the same visualization not only takes up space, but BI vendors are moving to capacity pricing. Companies now pay more if you have more dashboards, apps, and reports. Earlier, we spoke about dependencies. Keeping redundant assets increases the number of dependencies and therefore the complexity. This comes with a price tag.
The implications of asset failures differ, and the business’s repercussions can be minimal or drastic.
Different industries have distinct regulatory requirements to meet. The impact may be minimal if a report for an end-of-year close has a mislabeled column that the sales or marketing department uses, On the other hand, if a healthcare or financial report does not meet the needs of a HIPPA or SOX compliance report, the company and its C-level suite may face severe penalties and reputational damage. Another example is a report that is shared externally. During an update of the report specs, the low-level security was incorrectly applied, which caused people to have access to personal information.
The complexity of assets influences their likelihood of encountering issues.
The last thing a business wants is for a report or app to fail at a crucial moment. If you know the report is complex and has a lot of dependencies, then the probability of failure caused by IT changes is high. That means a change request should be taken into account. Dependency graphs become important. If it is a straightforward sales report that tells notes by salesperson by account, any changes made do not have the same impact on the report, even if it fails. BI operations should treat these reports differently during change.
Not all reports and dashboards fail the same; some reports may lag, definitions might change, or data accuracy and relevance could wane. Understanding these variations aids in better risk anticipation.

Marketing uses several reports for its campaigns – standard analytic assets often delivered through marketing tools. Finance has very complex reports converted from Excel to BI tools while incorporating different consolidation rules. The marketing reports have a different failure mode than the financial reports. They, therefore, need to be managed differently.

It’s time for the company’s monthly business review. The marketing department proceeds to report on leads acquired per salesperson. Unfortunately, half the team has left the organization, and the data fails to load accurately. While this is an inconvenience for the marketing group, it isn’t detrimental to the business. However, a failure in financial reporting for a human resource consulting firm with 1000s contractors that contains critical and complex calculations about sickness, fees, hours, etc, has major implications and needs to be managed differently.

Acknowledging that assets transition through distinct phases allows for effective management decisions at each stage. As new visualizations are released, the information leads to broad use and adoption.
Think back to the start of the pandemic. COVID dashboards were quickly put together and released to the business, showing pertinent information: how the virus spreads, demographics affected the business and risks, etc. At the time, it was relevant and served its purpose. As we moved past the pandemic, COVID-specific information became obsolete, and reporting is integrated into regular HR reporting.
Reports and dashboards are crafted to deliver valuable insights for stakeholders. Over time, though, the worth of assets changes.
When a company opens its first store in a certain area, there are many elements it needs to understand – other stores in the area, traffic patterns, pricing of products, what products to sell, etc. Once the store is operational for some time, specifics are not as important, and it can adopt the standard reporting. The tailor-made analytic assets become irrelevant and no longer add value to the store manager.