We just wrapped up a great Qlik Connect conference in Orlando. I was intrigued by the discussions of what AI may mean to the future of our industry. I found the panel with the AI Council especially stimulating, some great minds sharing their research and perspectives. I was especially struck by the common refrain that “we know AI will impact our businesses, but there is much unknown as to exactly what this will look like”.
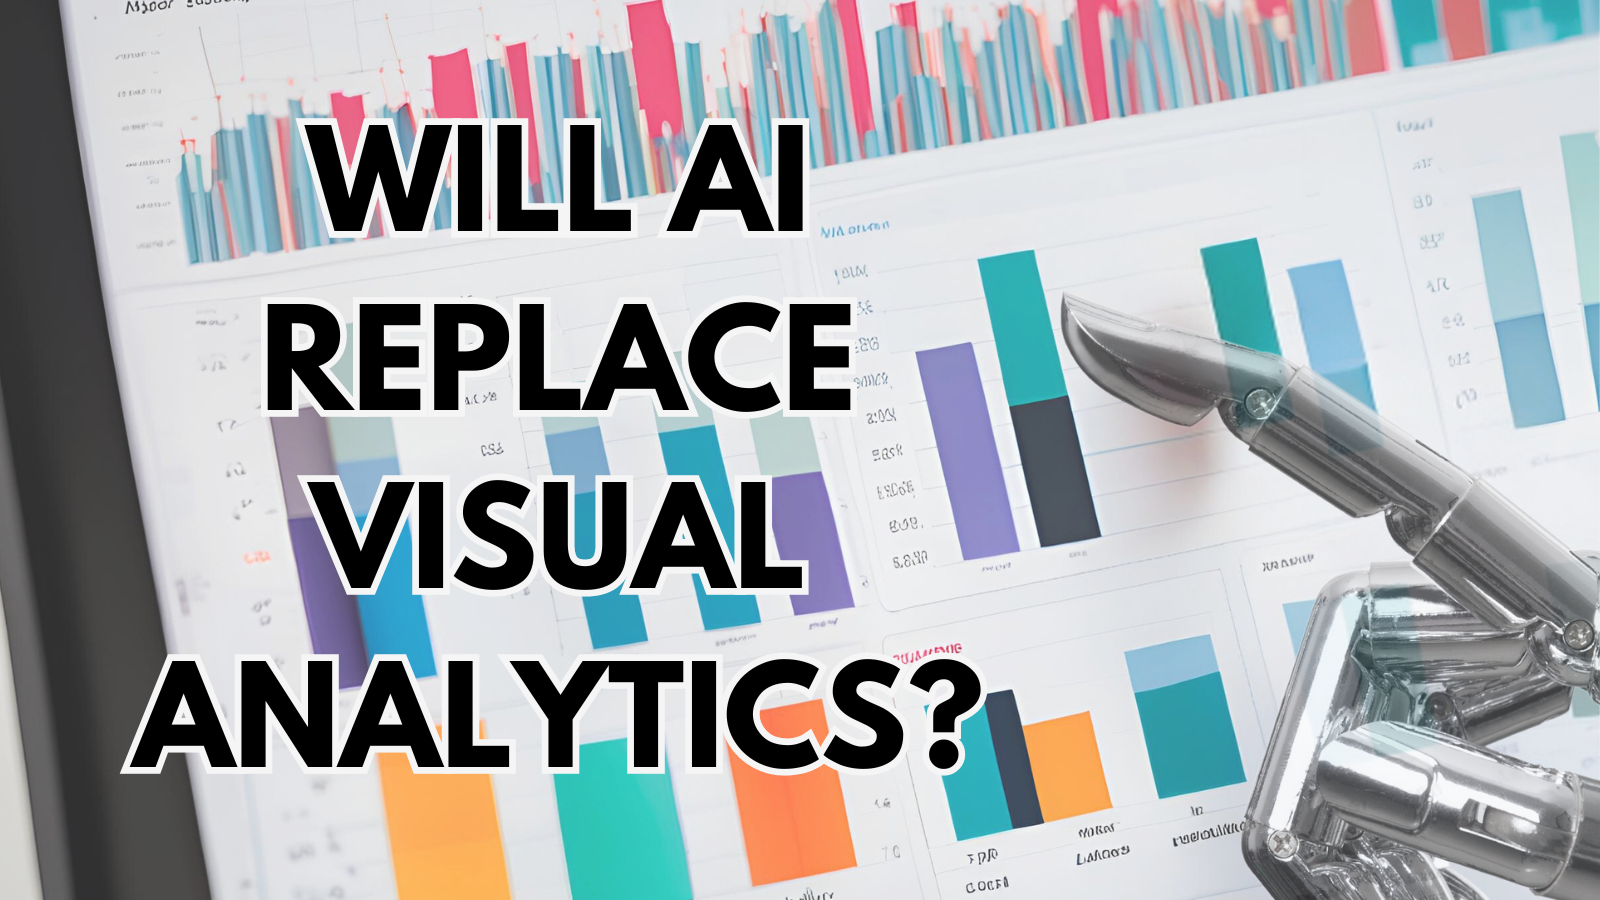
I’m of the mind that if we don’t know, let’s start working through some thought experiments. A potential that came up for me is: Generative AI, specifically RAG and private Enterprise LLMs, could replace the visual analysis function of Qlik Apps.
In Qlik Apps we create Dashboard visualizations. These visualizations provide answers to known questions, e.g. “what is current total sales vs target?” We also generate reports, a broader, although still summary view of a fixed point in time, for metrics like financial health. Both of these functions use carefully curated and validated data and will continue to do so.
In my Qlik trainings I use a story where a Leader sees the Dashboard values are out of compliance and tasks a Manager or staff analyst to explain the discrepancy. Sales are not meeting target, why?
A well designed Qlik App contains sufficiently detailed data with additional sheets and charts — containing dimensions and detail beyond the dashboard sheet — to filter and sift the data and allow a user to answer the ad hoc “why” question.
Through interaction with the analysis charts, we may find that the contributions of one salesrep, “Joe”, is causing the non-compliance. If we take Joe out of the mix we are on target. It’s likely this type of insight — what dimension(s) are responsible for the non-compliance — can be determined by a machine agent and a visual chart to support the determination can be generated on the fly. We are seeing that today.
Joe has been a stellar performer in previous periods. What has changed and what action should we take?
Could a Gen AI assistant be useful in this case? I shopped this scenario with a number of respected colleagues at the conference. One thread was “Joe’s spouse recently died and that understandably has affected his performance. A staff analyst could uncover this fact but an AI assistant would not”.
Could AI be aware of this event? There might be a record in the Enterprise HR system. Or public records such as obituary notices may be available. Or perhaps the staff analyst reached out to Joe via Teams and Joe shared this information. Could an AI assistant interview Joe and elicit the same information?
At the conference there was lots of talk about “trust”, which I understood to generally mean trust in the validity of the data. Should we also be talking about how we will ensure that employee, customer and partner interactions with Enterprise AI are consistent with privacy policies and regulations? If “AI” asks me for information, am I confident the information I provide will be properly categorized and subjected to relevant privacy and usage policies?
Can the AI assistant recommend an action plan? At Qlik Connect we saw how Qlik Answers can process unstructured documents like HR benefit policies. Could the assistant determine that Joe is eligible for company paid grief counseling services and draft an email to Joe offering help?
Another action may be to temporarily double team some of Joe’s accounts to relieve pressure on Joe and ensure that customers are getting optimal service. The AI assistant could identify appropriate salesreps based on product lines, region or other criteria.
What about “hallucinations”? That is, totally wrong answers from the AI assistant. I don’t see that as much of an issue. The assistant is not taking action directly, it is merely advising the leader. Staff analysts can “hallucinate” as well. I’ve been schooled a few times myself when I’ve delivered non-sensical answers. Leaders know their business. Also, the use of Gen AI also does not necessarily eliminate the staff analyst role. It may be that the analyst is using the AI assistant and curating the results for the leader.
If Gen AI can identify causes, generate supporting visuals and recommend action, do we need analysis charts in the Qlik App? Do we need detail data in the app if AI is already looking at a broader set of data? My best understanding of RAG is yes, we will require some level of detail data to provide context. But does that data need to live in the Qlik app data model if we are not using it in charts?
What do think? Will Gen AI kill off analysis charts? How do you see Generative AI changing what we build and deliver with Qlik?
– Rob Wunderlich