Post: Distribute Parameters to Multiple Cognos Report Views

Have you ever needed to update the parameters for a large number of report views? This can be very time consuming in Cognos Connection. For example, imagine a report which expects 15 parameters (normally populated via its prompt screen). Since filling out 15 parameters each time they execute this report is a bit taxing, its pretty common place for users to save report views of this report (to capture all of their parameter selections, and make launching the report much easier in the future).

Suppose we have 50 of these report views.

Now imagine a new requirement comes along and we add a 16th parameter to the report.

With the new parameter added, all 50 of the aforementioned report views are now insufficient. We need to update each of these 50 report views to account for the new parameter value.

Attempting to do this manually in Cognos Connection can be a very time consuming process.

Today’s blog entry will walk through the above example – updating the parameter values on multiple report views using the Property Distributor feature in MotioPI Professional.

First, we’ll go into Cognos Connection and manually add the new parameter to ONE of the report views (this report view becomes the “template” object in MotioPI). This step is done in the “normal” Cognos way, using Cognos Connection and the report’s associated prompt screen.

Now that we have a viable template, we’ll jump into MotioPI Professional to replicate selected parameter values from our template object onto many other report views.

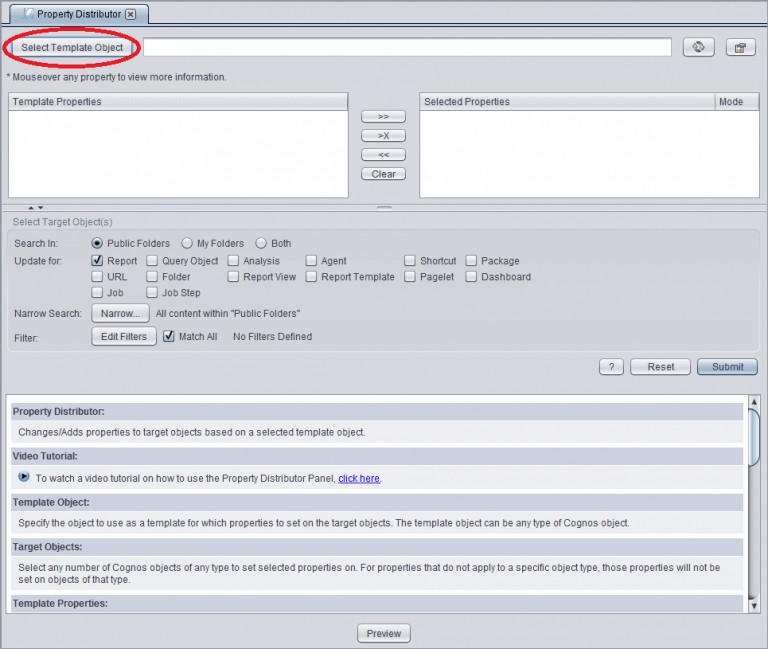
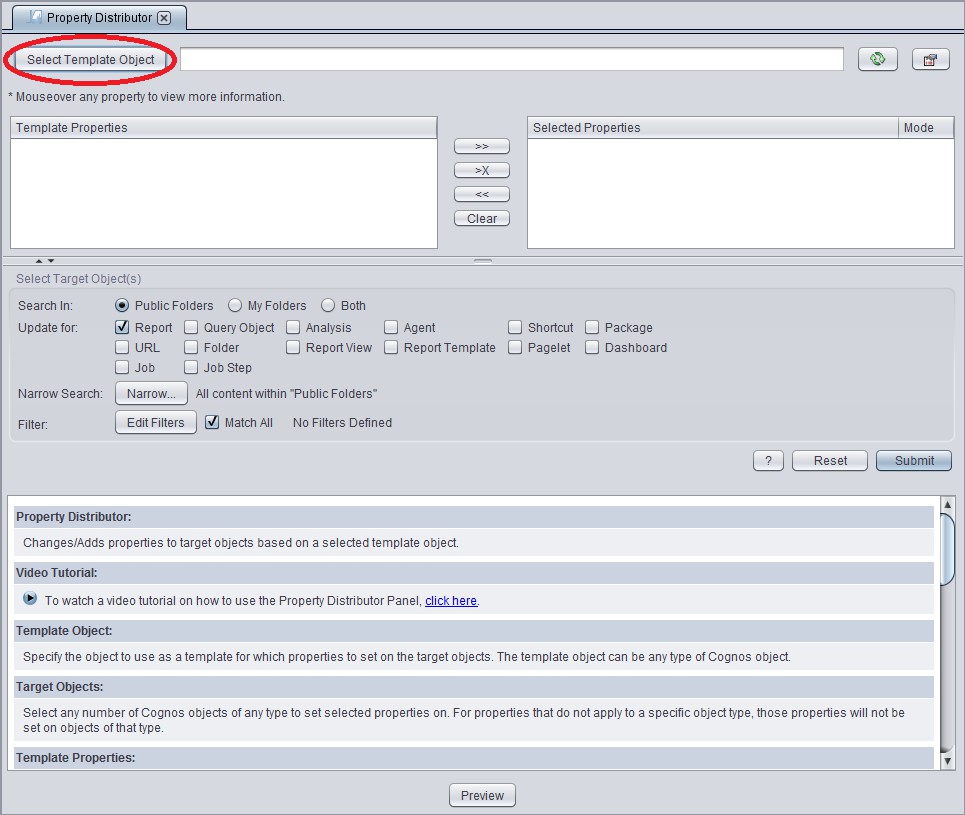
Open MotioPI Pro’s Property Distributor Panel. Select the template object, which will be the report view you manually adjusted in the previous step. Click on the “Select Template Object” button to bring up the Cognos Object Selector window.

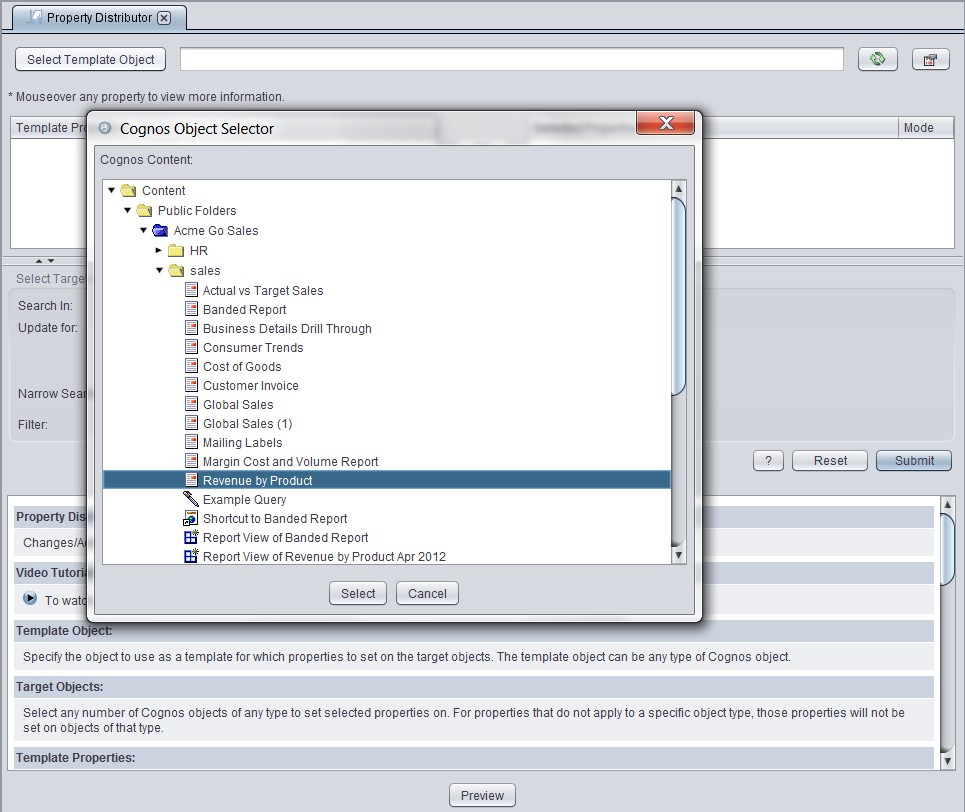
In the Cognos Selector window, use the tree to navigate and select the template object (in the screenshot below, we’re using a report, but you could just as easily use a report view). Click the “Select” button.

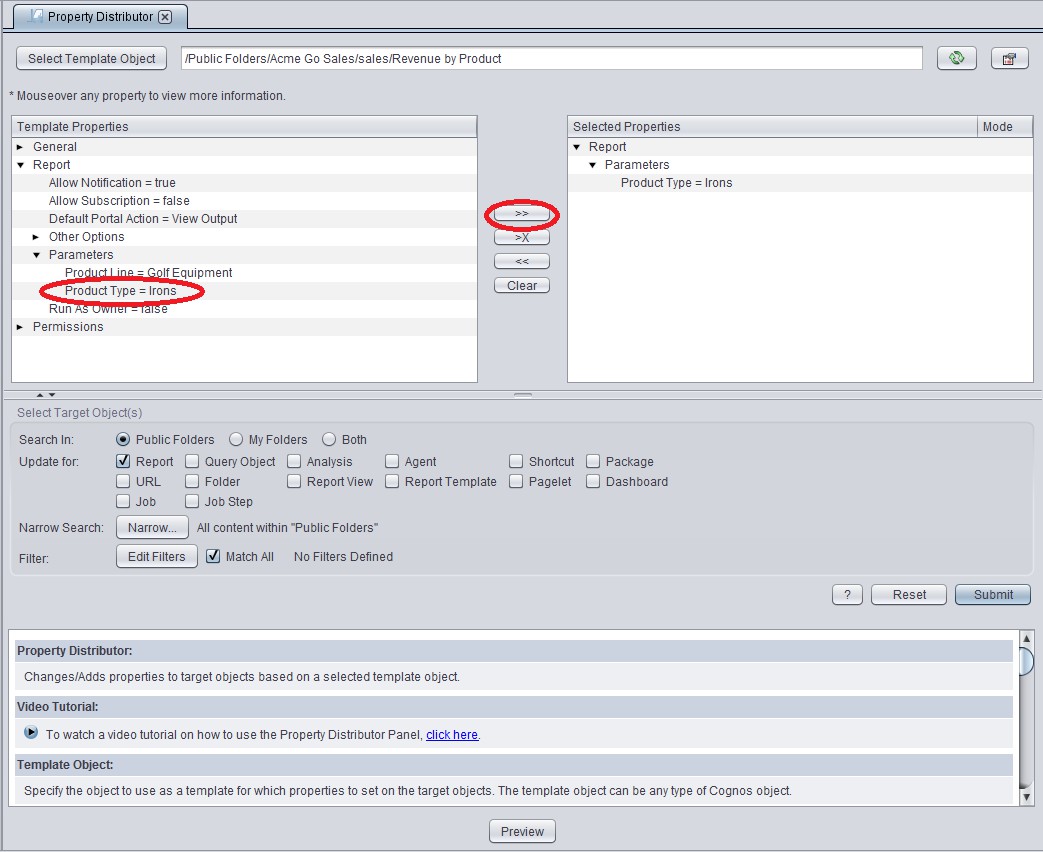
The “Template Properties” section on the left will show three drop downs, General, Report, and Permissions. These correspond to the three tabs you would see in Cognos Connection under the “Properties” of the report.

Select “Parameters” beneath the “Report” drop down and a list of parameters associated with the report will appear. Select your new parameter and move it to the “Selected Properties” section to the right using the move arrows button.

Now, under the “Select Target Object(s)” section, select the “Report View” check box.

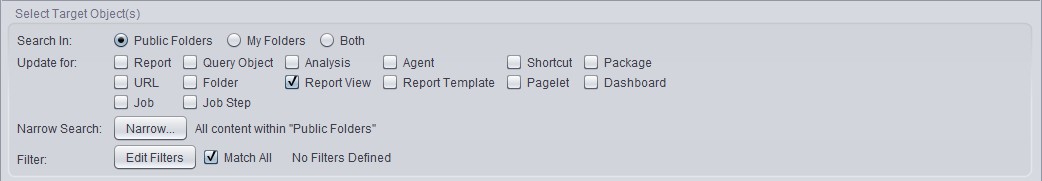
Use the “Narrow” button to search only the report views that need to be updated with the new parameter. Select the report views from the “Cognos Content” section on the left and move them to the “Selected Items” area using the move arrows. Click “Apply.”

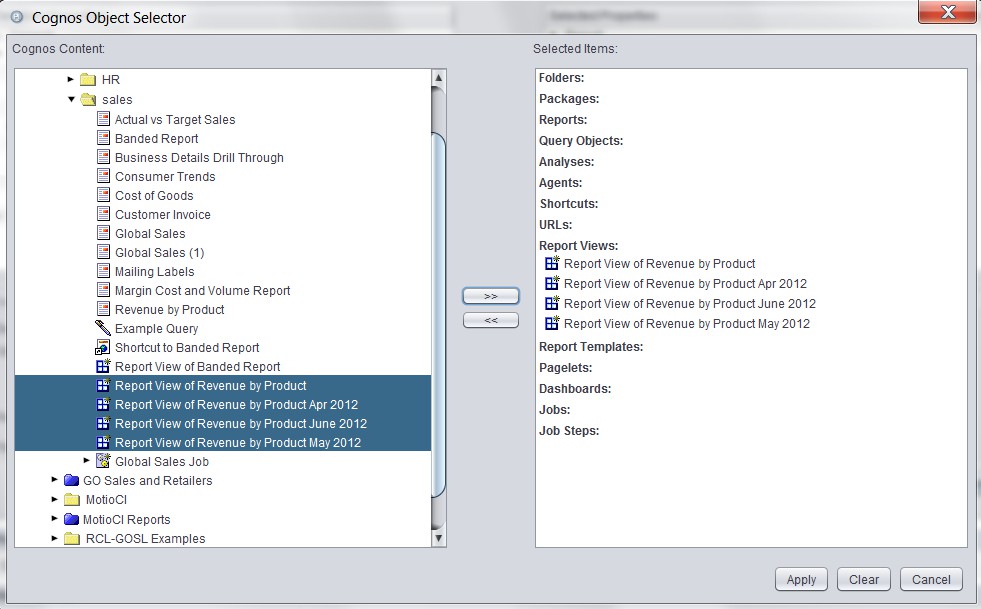
Next click the “Submit” button to grab the target objects (report views) you just selected from the “Cognos Object Selector” window.

Select each of the report views to update with the new parameter. Click “Preview” to evaluate the effects of adding the new parameter. This will validate each of the report views, both before and after adding the new parameter. This step also provides a detailed look at each target object’s old and new properties.

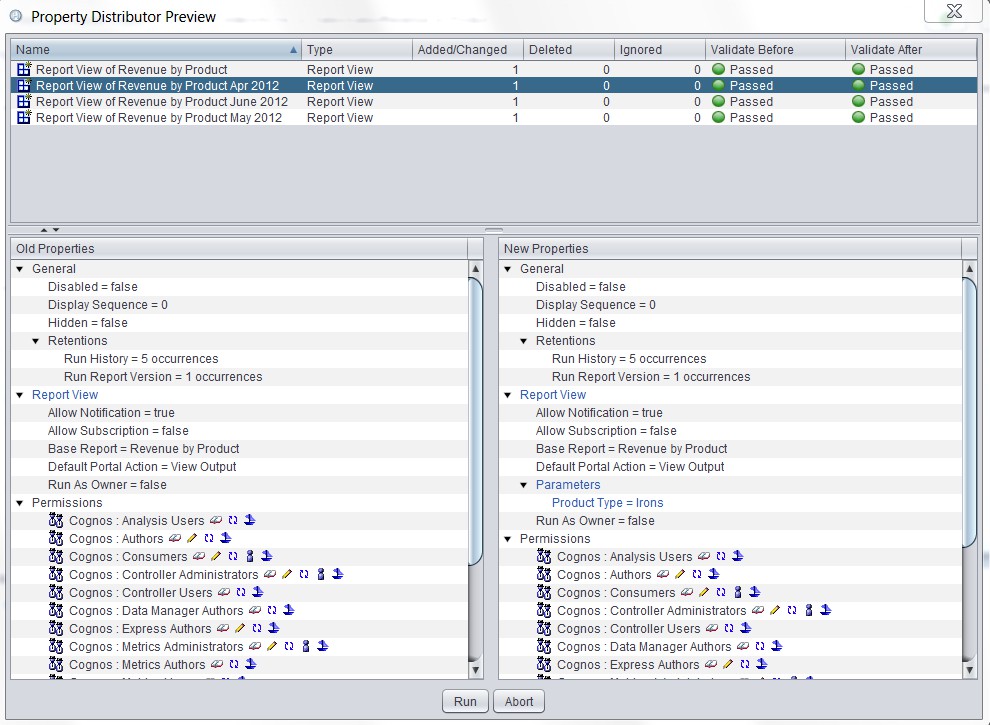
In the detailed window, you can see the additions made to this report view in blue: Parameters -> Product Type = Irons

To complete the task of updating all of these report views with the new parameter, click “Run” button.

Without the Property Distributor feature from MotioPI Pro this use case would have required an end user to manually find and adjust all associated report views within Cognos Connection. In the case of updating 50 report views, you can imagine how tedious this process would’ve been.

{{cta(’99bd8306-b529-4f23-a590-f1ea64205a3e’)}}


Scroll to Top
As the BI space evolves, organizations must take into account the bottom line of amassing analytics assets.
The more assets you have, the greater the cost to your business. There are the hard costs of keeping redundant assets, i.e., cloud or server capacity. Accumulating multiple versions of the same visualization not only takes up space, but BI vendors are moving to capacity pricing. Companies now pay more if you have more dashboards, apps, and reports. Earlier, we spoke about dependencies. Keeping redundant assets increases the number of dependencies and therefore the complexity. This comes with a price tag.
The implications of asset failures differ, and the business’s repercussions can be minimal or drastic.
Different industries have distinct regulatory requirements to meet. The impact may be minimal if a report for an end-of-year close has a mislabeled column that the sales or marketing department uses, On the other hand, if a healthcare or financial report does not meet the needs of a HIPPA or SOX compliance report, the company and its C-level suite may face severe penalties and reputational damage. Another example is a report that is shared externally. During an update of the report specs, the low-level security was incorrectly applied, which caused people to have access to personal information.
The complexity of assets influences their likelihood of encountering issues.
The last thing a business wants is for a report or app to fail at a crucial moment. If you know the report is complex and has a lot of dependencies, then the probability of failure caused by IT changes is high. That means a change request should be taken into account. Dependency graphs become important. If it is a straightforward sales report that tells notes by salesperson by account, any changes made do not have the same impact on the report, even if it fails. BI operations should treat these reports differently during change.
Not all reports and dashboards fail the same; some reports may lag, definitions might change, or data accuracy and relevance could wane. Understanding these variations aids in better risk anticipation.

Marketing uses several reports for its campaigns – standard analytic assets often delivered through marketing tools. Finance has very complex reports converted from Excel to BI tools while incorporating different consolidation rules. The marketing reports have a different failure mode than the financial reports. They, therefore, need to be managed differently.

It’s time for the company’s monthly business review. The marketing department proceeds to report on leads acquired per salesperson. Unfortunately, half the team has left the organization, and the data fails to load accurately. While this is an inconvenience for the marketing group, it isn’t detrimental to the business. However, a failure in financial reporting for a human resource consulting firm with 1000s contractors that contains critical and complex calculations about sickness, fees, hours, etc, has major implications and needs to be managed differently.

Acknowledging that assets transition through distinct phases allows for effective management decisions at each stage. As new visualizations are released, the information leads to broad use and adoption.
Think back to the start of the pandemic. COVID dashboards were quickly put together and released to the business, showing pertinent information: how the virus spreads, demographics affected the business and risks, etc. At the time, it was relevant and served its purpose. As we moved past the pandemic, COVID-specific information became obsolete, and reporting is integrated into regular HR reporting.
Reports and dashboards are crafted to deliver valuable insights for stakeholders. Over time, though, the worth of assets changes.
When a company opens its first store in a certain area, there are many elements it needs to understand – other stores in the area, traffic patterns, pricing of products, what products to sell, etc. Once the store is operational for some time, specifics are not as important, and it can adopt the standard reporting. The tailor-made analytic assets become irrelevant and no longer add value to the store manager.