Post: Document Cognos User Security

Using MotioPI’s User Access panel you can quickly and easily identify (and export) security information on IBM Cognos users. The readily available information includes:

  • The user’s access levels to specific Cognos content
  • The user’s group and role memberships

This blog entry illustrates how to access and export Cognos users’ security settings using MotioPI.

NOTE: The following steps assume that MotioPI has already been configured to point at the Active Directory or LDAP Instance used by your Cognos environment (see this blog entry for instructions on how to configure this.)

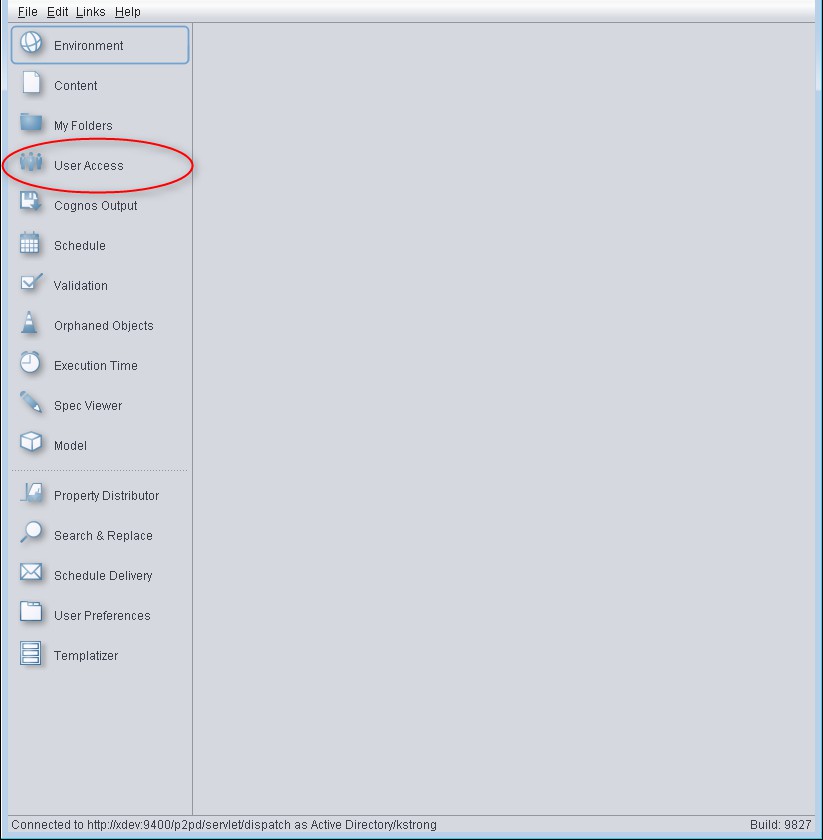
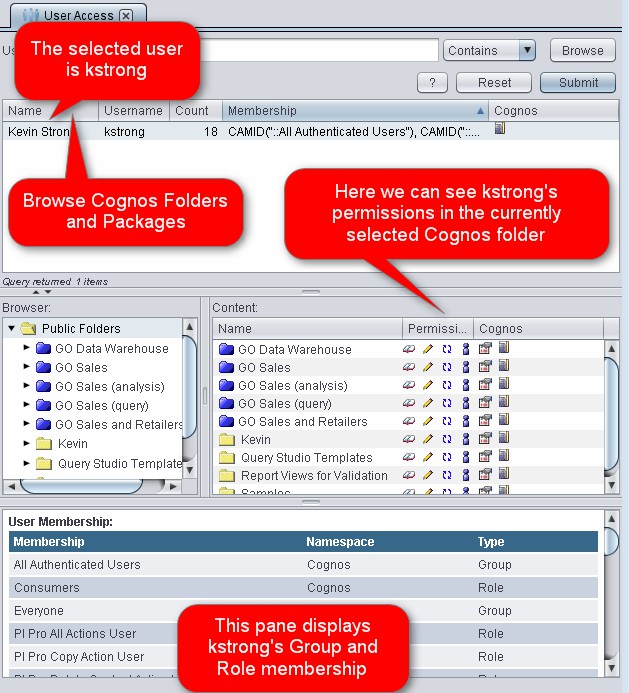
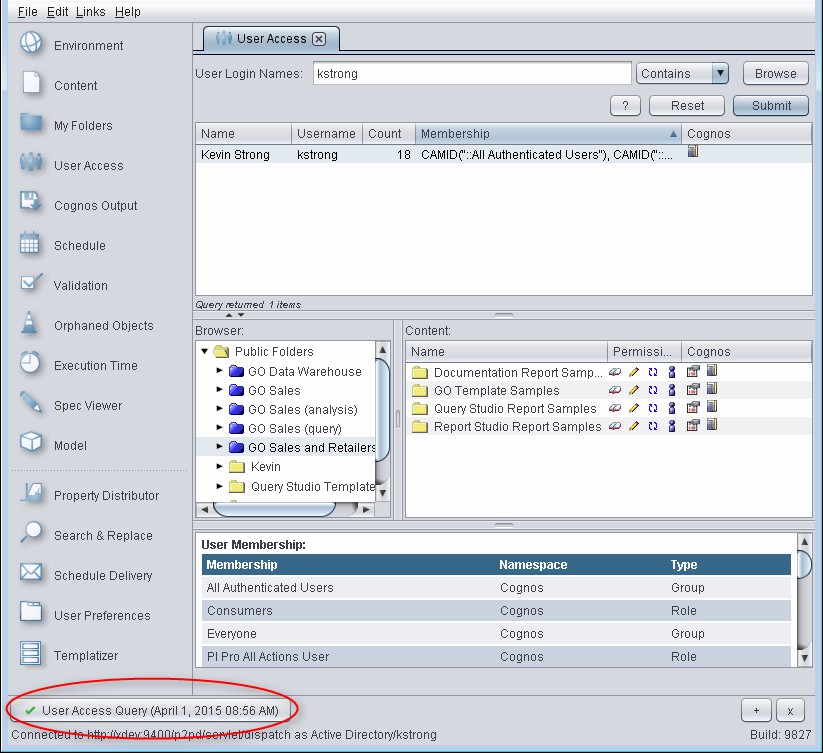
1. Select the User Access Panel

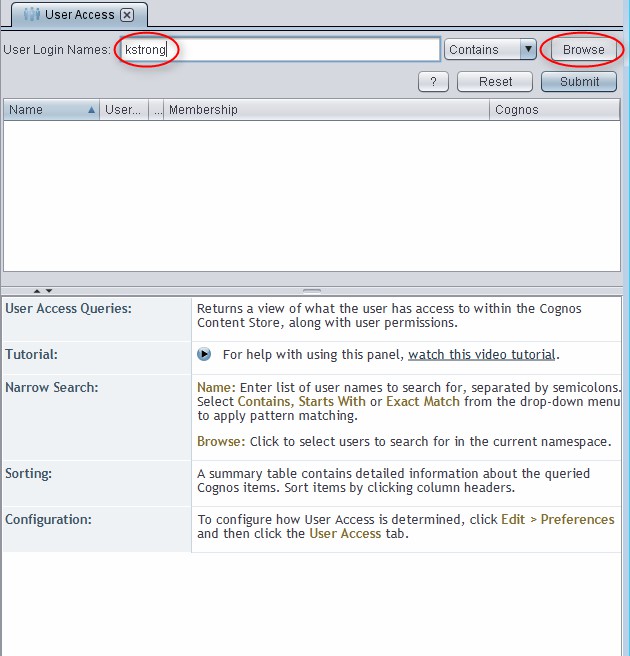
2. Enter Cognos user names manually or choose from a list of current users.

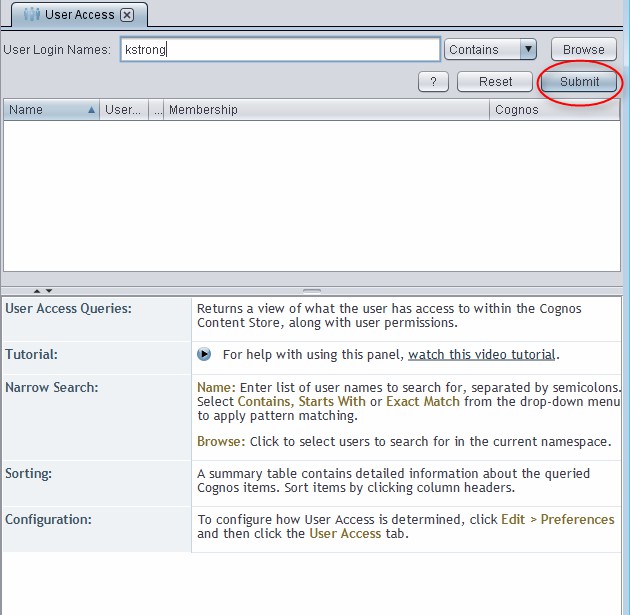
3. Click the submit button and the query will return the users of interest.

4. Now you can select a specific user to examine that user’s permissions on Cognos content as well as the user’s group / role membership (in the bottom pane).

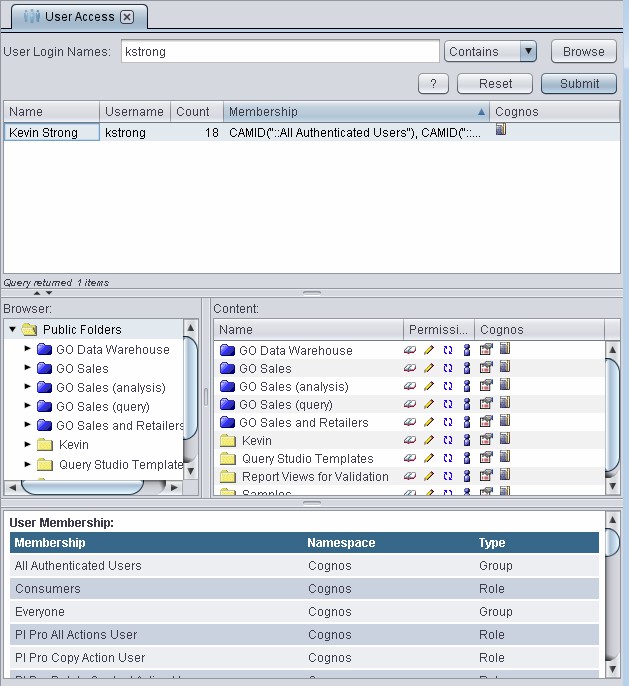
5. As you navigate the tree in the Browser pane, you’ll see the content in each selected folder along with the selected user’s permissions in the Content pane. Now, let us assume you are interested in only the permissions for a specific package and all objects inside of it. You would click on that package in the Browser pane.

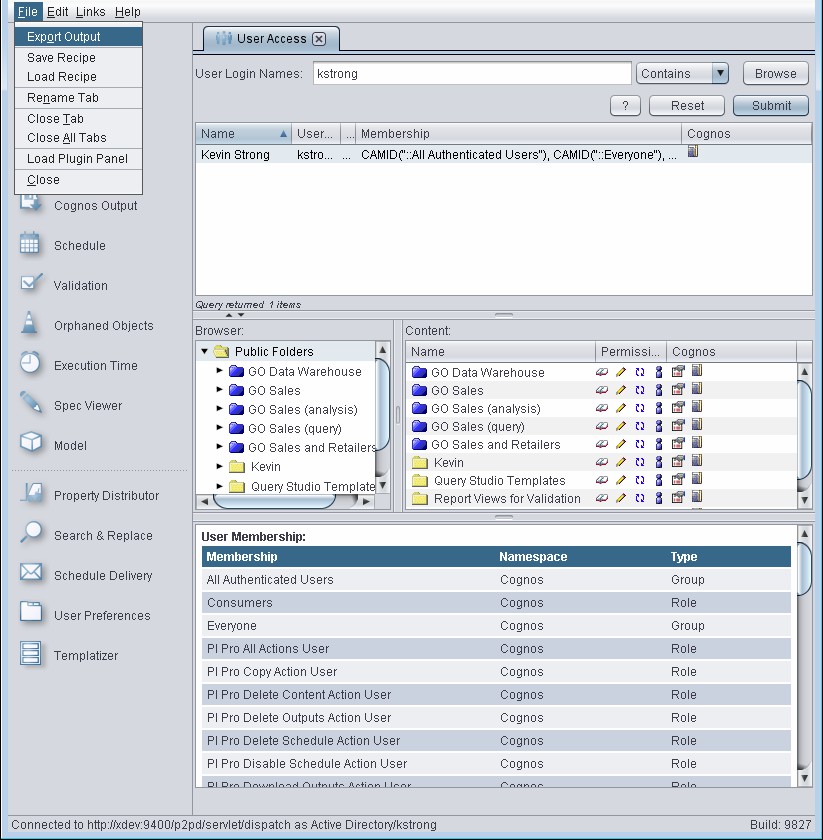
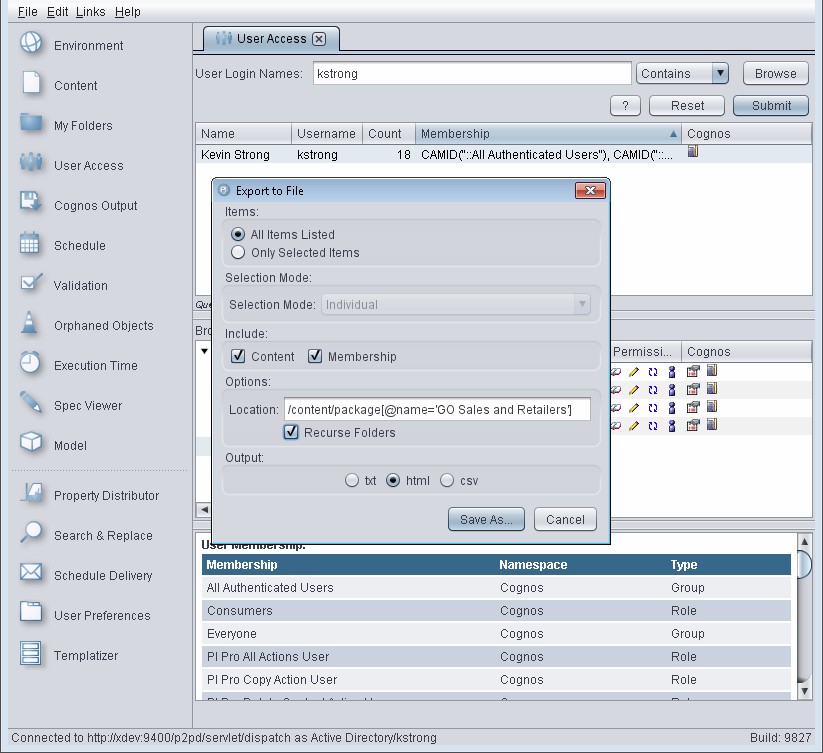
6. Now that you’ve selected the root package / folder that you’re interested in, you can export the policy information as an HTML / CSV / Text report. To export go to File | Export Output.

7. From the Export to File window, customize your output by choosing:

  • All items or narrow down to include only selected items
  • Include both content and membership to view this user’s security for all selected content
  • Select recurse folders in order to list content permissions for all objects within the selected package
  • Choose from txt, html, or csv output options
    8. You will then see a Save dialog where you can select the location to save the output (and the name of the output file).

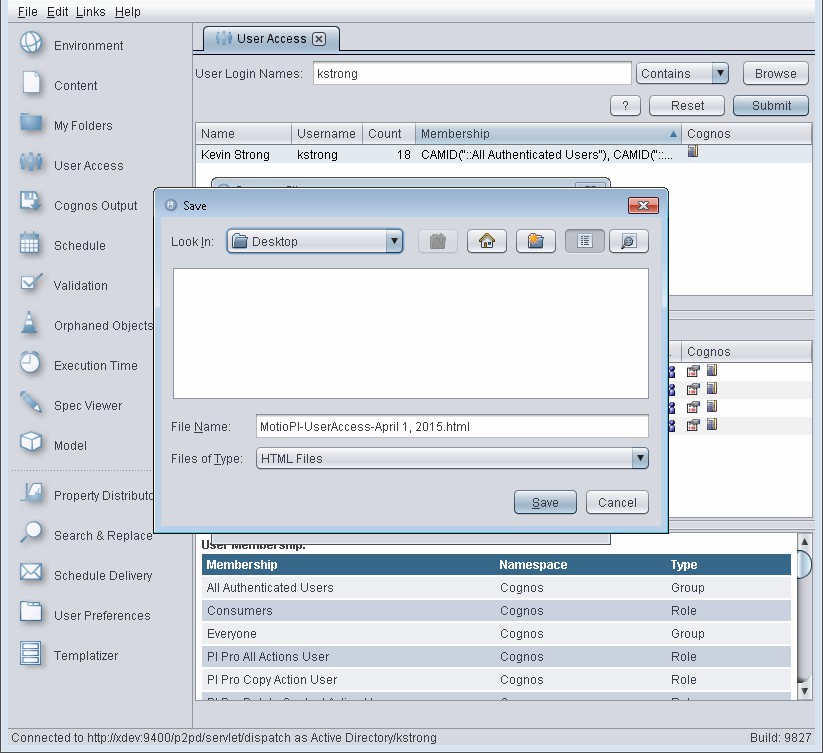
9. Once the export is complete, MotioPI will provide a button to launch the output directly from MotioPI.

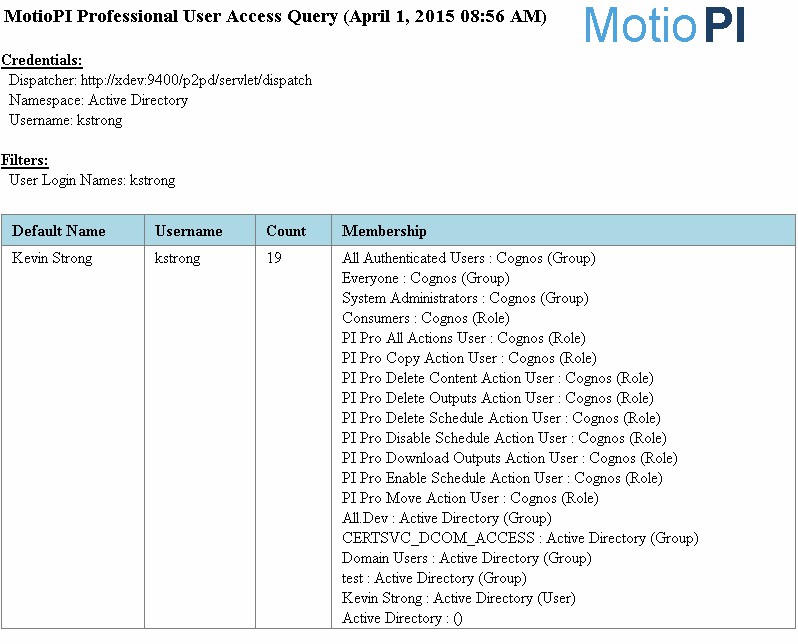
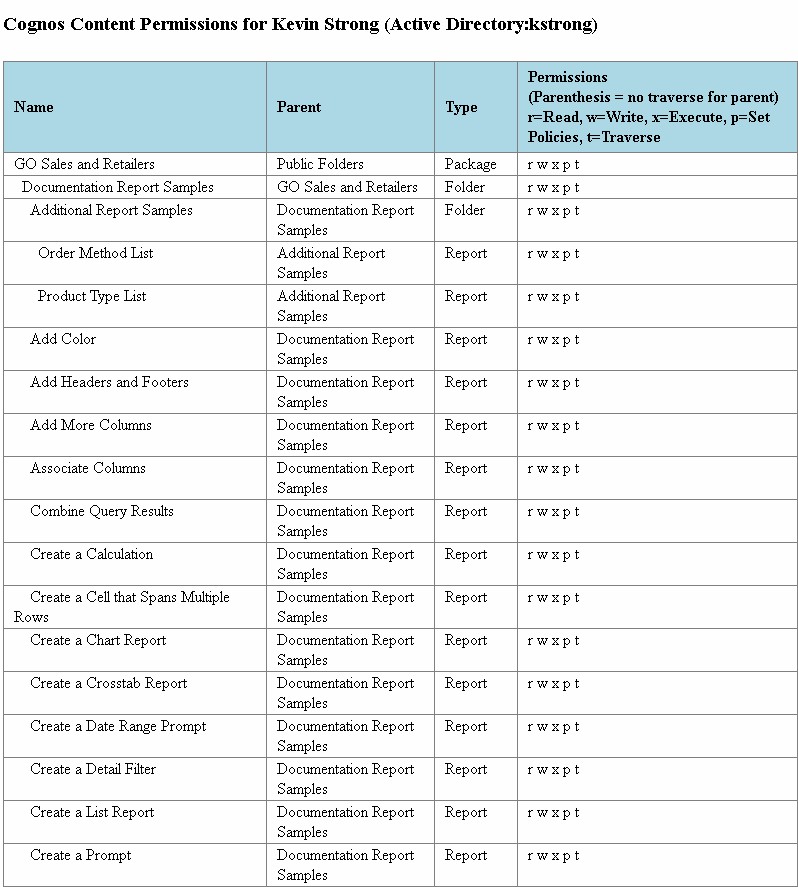
10. Here is an example of the HTML output generated above. Note that it includes both the group / role membership for the user kstrong, as well as his permissions for all Cognos content which is contained below the “GO Sales (query)” package (the selected package).

{{cta(‘1464db86-c7a4-4362-a17b-99feefb18ca8’)}}

{{cta(‘7bac48d8-f050-45a6-b7e7-b00be897fab8’)}}

Scroll to Top
As the BI space evolves, organizations must take into account the bottom line of amassing analytics assets.
The more assets you have, the greater the cost to your business. There are the hard costs of keeping redundant assets, i.e., cloud or server capacity. Accumulating multiple versions of the same visualization not only takes up space, but BI vendors are moving to capacity pricing. Companies now pay more if you have more dashboards, apps, and reports. Earlier, we spoke about dependencies. Keeping redundant assets increases the number of dependencies and therefore the complexity. This comes with a price tag.
The implications of asset failures differ, and the business’s repercussions can be minimal or drastic.
Different industries have distinct regulatory requirements to meet. The impact may be minimal if a report for an end-of-year close has a mislabeled column that the sales or marketing department uses, On the other hand, if a healthcare or financial report does not meet the needs of a HIPPA or SOX compliance report, the company and its C-level suite may face severe penalties and reputational damage. Another example is a report that is shared externally. During an update of the report specs, the low-level security was incorrectly applied, which caused people to have access to personal information.
The complexity of assets influences their likelihood of encountering issues.
The last thing a business wants is for a report or app to fail at a crucial moment. If you know the report is complex and has a lot of dependencies, then the probability of failure caused by IT changes is high. That means a change request should be taken into account. Dependency graphs become important. If it is a straightforward sales report that tells notes by salesperson by account, any changes made do not have the same impact on the report, even if it fails. BI operations should treat these reports differently during change.
Not all reports and dashboards fail the same; some reports may lag, definitions might change, or data accuracy and relevance could wane. Understanding these variations aids in better risk anticipation.

Marketing uses several reports for its campaigns – standard analytic assets often delivered through marketing tools. Finance has very complex reports converted from Excel to BI tools while incorporating different consolidation rules. The marketing reports have a different failure mode than the financial reports. They, therefore, need to be managed differently.

It’s time for the company’s monthly business review. The marketing department proceeds to report on leads acquired per salesperson. Unfortunately, half the team has left the organization, and the data fails to load accurately. While this is an inconvenience for the marketing group, it isn’t detrimental to the business. However, a failure in financial reporting for a human resource consulting firm with 1000s contractors that contains critical and complex calculations about sickness, fees, hours, etc, has major implications and needs to be managed differently.

Acknowledging that assets transition through distinct phases allows for effective management decisions at each stage. As new visualizations are released, the information leads to broad use and adoption.
Think back to the start of the pandemic. COVID dashboards were quickly put together and released to the business, showing pertinent information: how the virus spreads, demographics affected the business and risks, etc. At the time, it was relevant and served its purpose. As we moved past the pandemic, COVID-specific information became obsolete, and reporting is integrated into regular HR reporting.
Reports and dashboards are crafted to deliver valuable insights for stakeholders. Over time, though, the worth of assets changes.
When a company opens its first store in a certain area, there are many elements it needs to understand – other stores in the area, traffic patterns, pricing of products, what products to sell, etc. Once the store is operational for some time, specifics are not as important, and it can adopt the standard reporting. The tailor-made analytic assets become irrelevant and no longer add value to the store manager.