Post: How to Identify Cognos Reports with Embedded SQL

A common question that keeps getting asked of the MotioPI Support Staff is how to identify IBM Cognos reports, queries, etc. that utilize in-line SQL in their specifications. While most reports leverage a package to access your data warehouse, it is possible for reports to run SQL statements directly against the database, bypassing your package. Let’s talk about why it’s important to know which reports have embedded SQL.


Why it’s Important to Identify Cognos Reports with Embedded SQL

Due to the nature of hard-coded SQL statements, they require continual oversight and maintenance. In fact, if you make changes in your database it can be almost impossible to identify which reports have assumptions built in to their in-line SQL. Until they fail to run that is. Because of how difficult it is to maintain reports with embedded SQL, it is imperative to identify them so you can provide them the extra attention they require. This attention can take the form of removing the embedded SQL or updating the SQL to conform with changes to your data warehouse. Let’s explore how to use MotioPI to identify these “special” reports.

How to Use MotioPI to Find Cognos Reports with Embedded SQL

The Search & Replace Panel in MotioPI is designed to search over the specifications of your report, identify reports that match criteria set by you, and even perform simple changes on a set of Cognos objects. Today we will utilize the search feature of Search & Replace to quickly identify all reports that use embedded SQL so you can validate their contents, convert them to use the model, or remove them from production altogether.

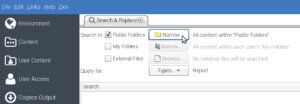
    1. Open the Search & Replace panel in MotioPI. If needed, narrow down your search to only cover sections of your content store, which can be particularly helpful if you are only concerned with a subsection of your content store or are concerned about the speed of your search in MotioPI. To Narrow, select the “Narrow” button
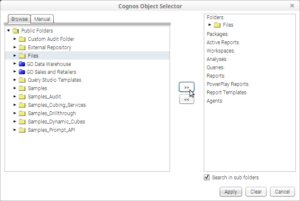
    2. Select the files or folder that you want to conduct your search in and then select the “>>” button.
    3. Enter in “<sqlText>” (without quotes) in the search field.
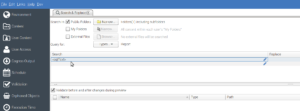
    4. Press the “Search” button.
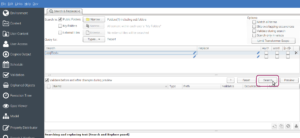
    5. MotioPI will return all reports that contain embedded SQL from your search.
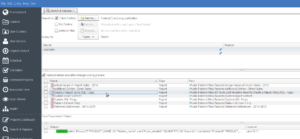
    6. Note that you can mouse over a snippet to see the full text of your SQL. 
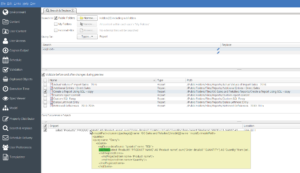
    7.  Once you have located all of your reports with embedded SQL, you can document them using the export feature in MotioPI (File->Export output), move them to one location using MotioPI so that you can easily locate them in the future, or even perform simple transformations on the spec using the “Replace” feature of the Search & Replace Panel.

CONCLUSION:

That is how you can use the Search & Replace panel in MotioPI to identify all reports with embedded SQL. You may get a few false positives using this technique, but that is done so that MotioPI does not miss any reports with embedded SQL. You can also narrow your search terms so that you only search for the exact syntax of your SQL statements. If you have any questions about how to best use the Search & Replace Panel, just ask below in the comments, I’m always happy to share any Cognos knowledge I may have!

Scroll to Top
As the BI space evolves, organizations must take into account the bottom line of amassing analytics assets.
The more assets you have, the greater the cost to your business. There are the hard costs of keeping redundant assets, i.e., cloud or server capacity. Accumulating multiple versions of the same visualization not only takes up space, but BI vendors are moving to capacity pricing. Companies now pay more if you have more dashboards, apps, and reports. Earlier, we spoke about dependencies. Keeping redundant assets increases the number of dependencies and therefore the complexity. This comes with a price tag.
The implications of asset failures differ, and the business’s repercussions can be minimal or drastic.
Different industries have distinct regulatory requirements to meet. The impact may be minimal if a report for an end-of-year close has a mislabeled column that the sales or marketing department uses, On the other hand, if a healthcare or financial report does not meet the needs of a HIPPA or SOX compliance report, the company and its C-level suite may face severe penalties and reputational damage. Another example is a report that is shared externally. During an update of the report specs, the low-level security was incorrectly applied, which caused people to have access to personal information.
The complexity of assets influences their likelihood of encountering issues.
The last thing a business wants is for a report or app to fail at a crucial moment. If you know the report is complex and has a lot of dependencies, then the probability of failure caused by IT changes is high. That means a change request should be taken into account. Dependency graphs become important. If it is a straightforward sales report that tells notes by salesperson by account, any changes made do not have the same impact on the report, even if it fails. BI operations should treat these reports differently during change.
Not all reports and dashboards fail the same; some reports may lag, definitions might change, or data accuracy and relevance could wane. Understanding these variations aids in better risk anticipation.

Marketing uses several reports for its campaigns – standard analytic assets often delivered through marketing tools. Finance has very complex reports converted from Excel to BI tools while incorporating different consolidation rules. The marketing reports have a different failure mode than the financial reports. They, therefore, need to be managed differently.

It’s time for the company’s monthly business review. The marketing department proceeds to report on leads acquired per salesperson. Unfortunately, half the team has left the organization, and the data fails to load accurately. While this is an inconvenience for the marketing group, it isn’t detrimental to the business. However, a failure in financial reporting for a human resource consulting firm with 1000s contractors that contains critical and complex calculations about sickness, fees, hours, etc, has major implications and needs to be managed differently.

Acknowledging that assets transition through distinct phases allows for effective management decisions at each stage. As new visualizations are released, the information leads to broad use and adoption.
Think back to the start of the pandemic. COVID dashboards were quickly put together and released to the business, showing pertinent information: how the virus spreads, demographics affected the business and risks, etc. At the time, it was relevant and served its purpose. As we moved past the pandemic, COVID-specific information became obsolete, and reporting is integrated into regular HR reporting.
Reports and dashboards are crafted to deliver valuable insights for stakeholders. Over time, though, the worth of assets changes.
When a company opens its first store in a certain area, there are many elements it needs to understand – other stores in the area, traffic patterns, pricing of products, what products to sell, etc. Once the store is operational for some time, specifics are not as important, and it can adopt the standard reporting. The tailor-made analytic assets become irrelevant and no longer add value to the store manager.