Post: IBM Cognos Framework Manager – Improve Model Elements Editing

One of MotioPI Pro’s basic fundamentals is to improve workflows and how administrative tasks are done in IBM Cognos in order to “give time back” to Cognos users. Today’s blog will discuss how to improve the workflow around editing Cognos Framework Manager model element names, descriptions, and tooltips. We will demonstrate a MotioPI Pro feature that makes it easy to update the information that business users see- model terminology elements.

Framework Manager is a heavyweight tool best left to the experts, the Cognos Ninja modelers. If you are not a member of this elite group, the risk of you unintentionally messing up the models for the rest of the organization is too high, therefore your access is denied! On the flip side, the business analyst user community is much better at naming model elements that make sense to them. Getting these model element names, descriptions, and tooltips correctly named is important for business users to easily find what they are reporting on and to be confident they are reporting on the right things.

While it is extremely important to have control over who has access to Framework Manager to ensure the integrity of the models, this also puts limits on the business user community to quickly get model name changes made. Our PI Pro feature solves this problem by enabling business users to make model terminology changes while keeping the integrity of the model safe.

Let’s get to it!

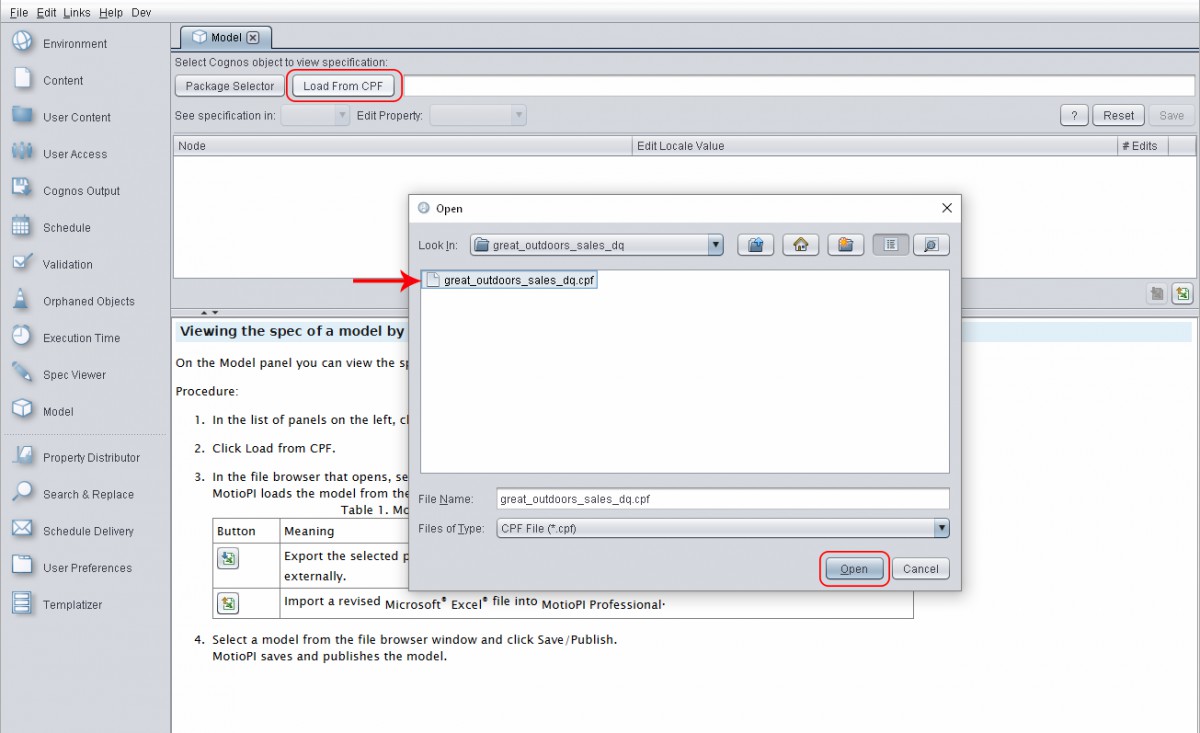
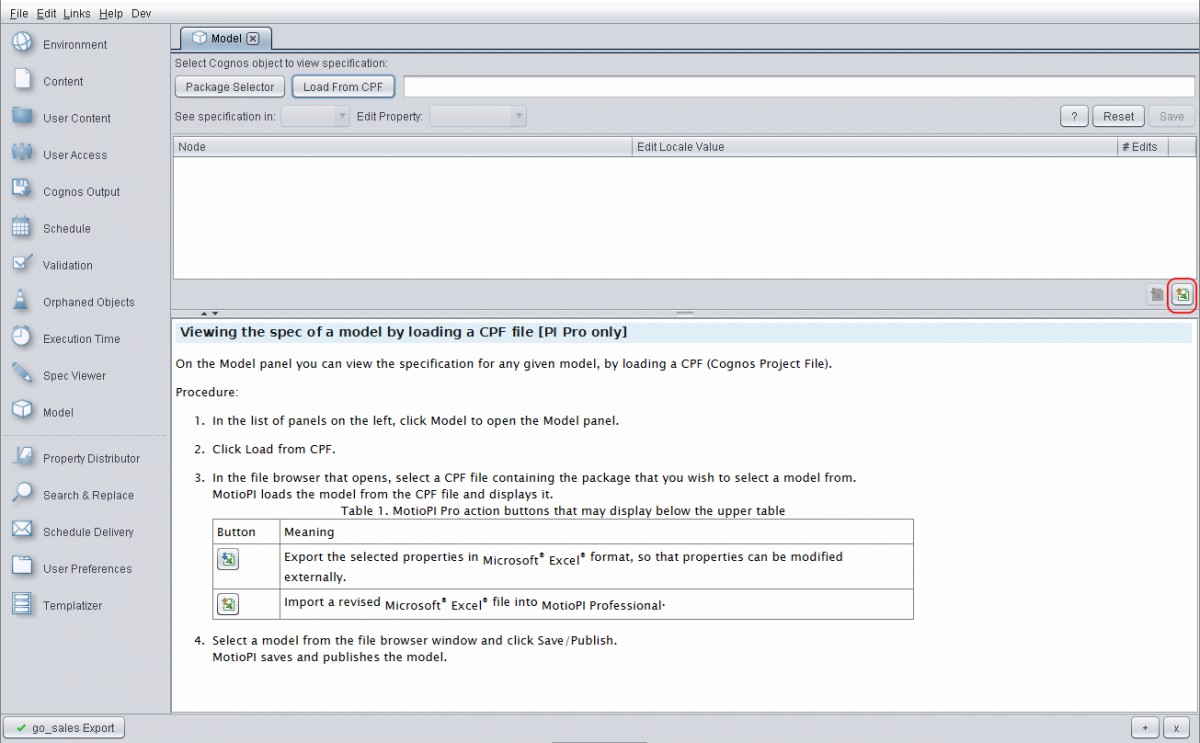
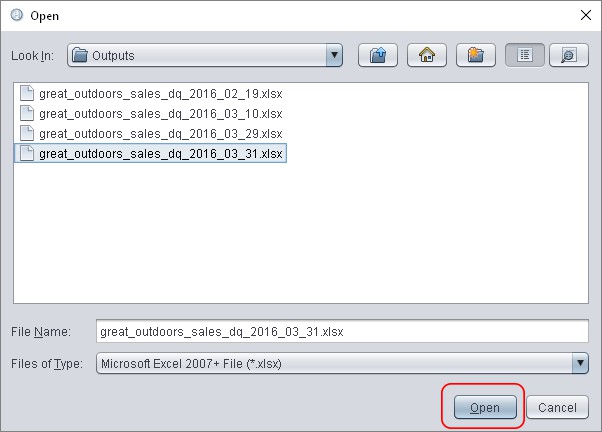
1. Open the “Model Panel” in MotioPI Pro and select the “Load From CPF” button. Choose a model to edit and click “Open.”

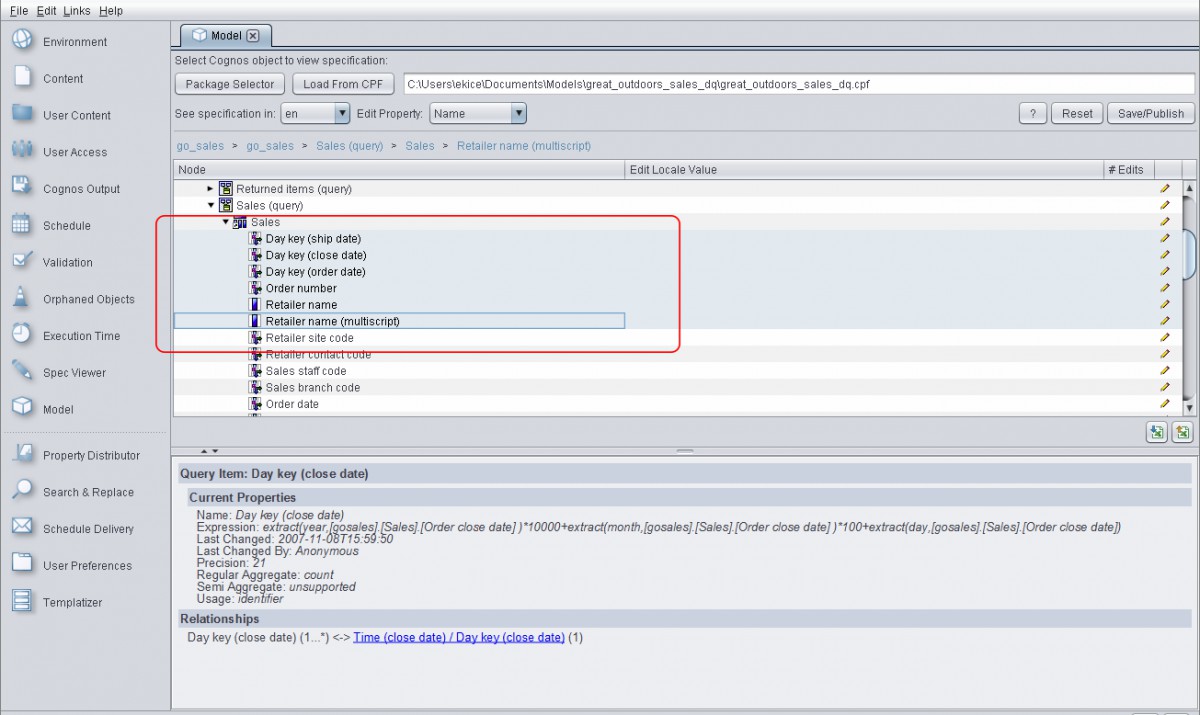
2. Highlight the specific element names to be changed.

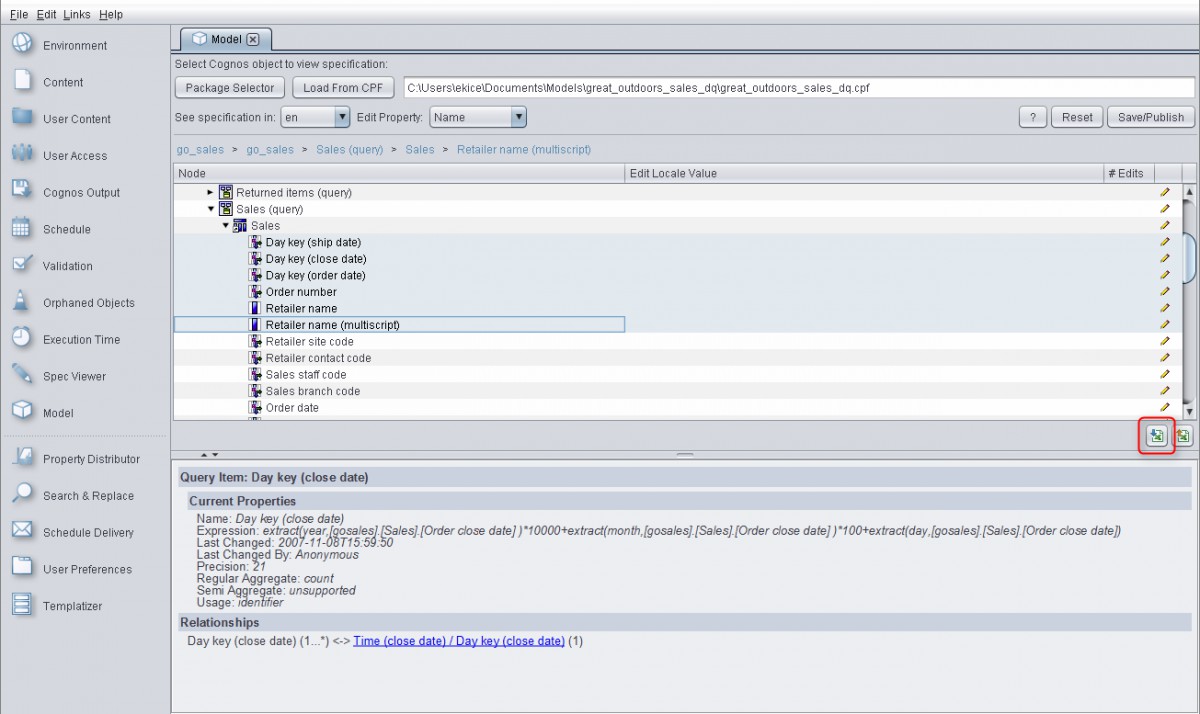
3. Select the “Export” button to export these model elements into Excel.

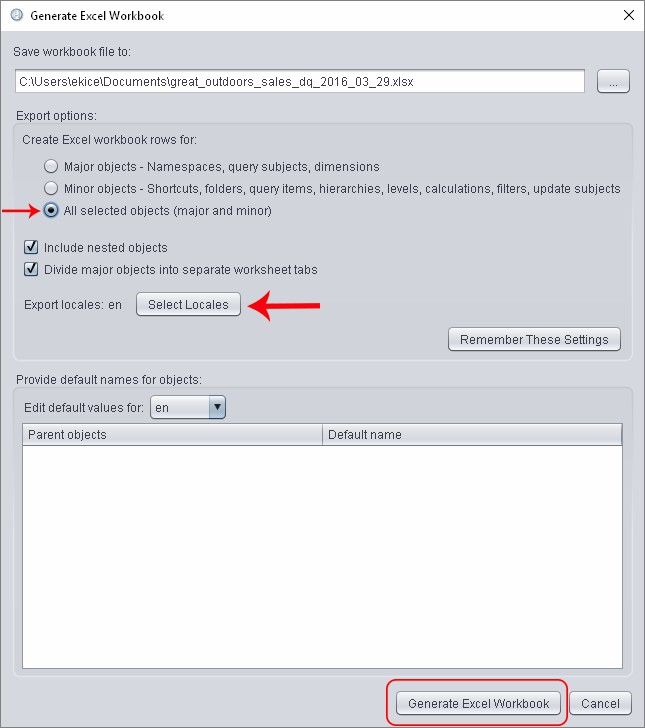
4. A dialog window will appear where you can specify the object types to export along with the locales. Click the “Generate Excel Workbook” button to save the file.

5. You will then see a button at the bottom left of the MotioPI screen that will open up this Excel file so you can make changes, or you may choose to distribute this Excel document to other members of your user community so that they can modify as needed.

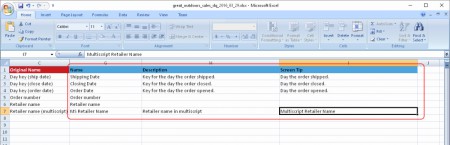
6. From Excel, we see the original model element names listed under the red highlighted title column. Your user community can simply make the required changes and additions under the blue highlighted title columns. In this example, we’ve changed the names, and have added tool tips and descriptions.

7. Once your team of naming experts is satisfied with the edits, save the Excel file. In PI Pro, go back to the Model Panel and select the “Import” button.

8. Select the Excel file that contains your modified model elements and this will import the changes directly to the model within MotioPI Pro.

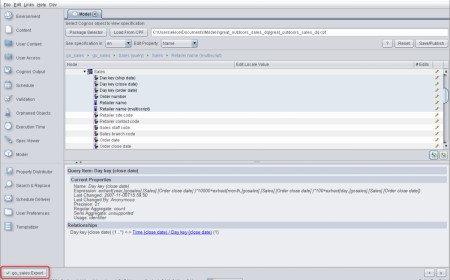
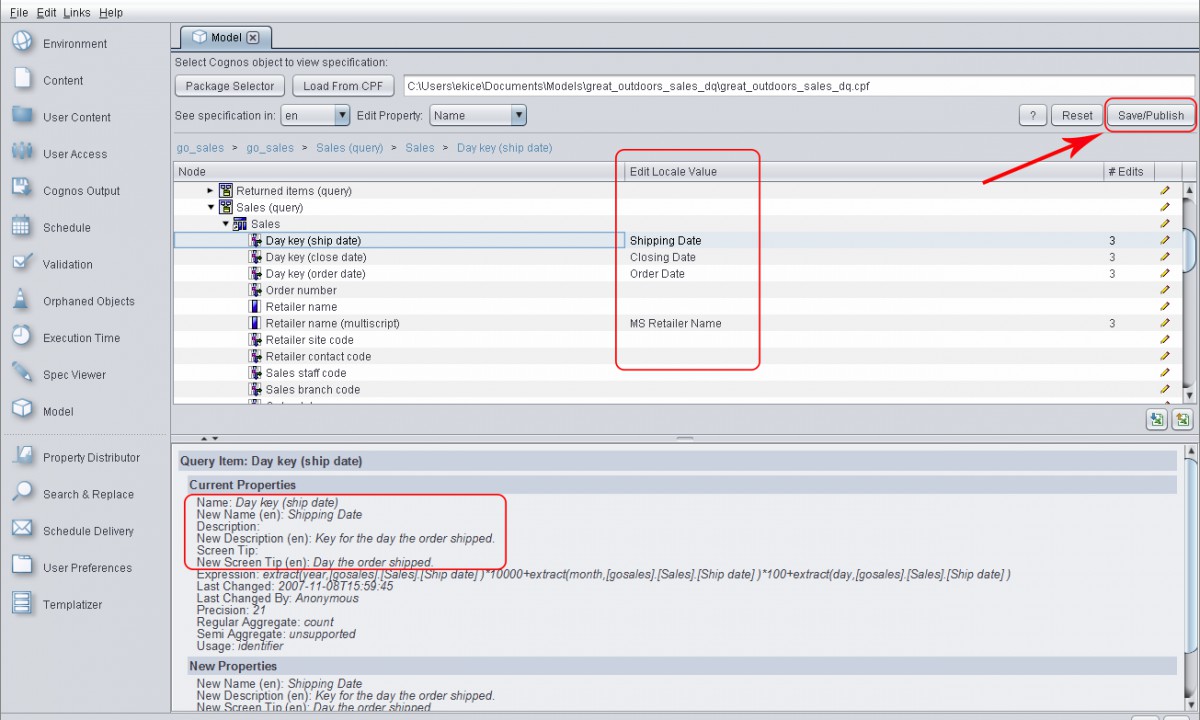
9. As you can see, the changes made in Excel are reflected in the “Edit Locale Value” column and also in the summary section. Then click the “Save/Publish” button to update the changes to the model.

As you can see, this feature creates a safe and efficient way for the business user community to make model element terminology changes.

Scroll to Top
As the BI space evolves, organizations must take into account the bottom line of amassing analytics assets.
The more assets you have, the greater the cost to your business. There are the hard costs of keeping redundant assets, i.e., cloud or server capacity. Accumulating multiple versions of the same visualization not only takes up space, but BI vendors are moving to capacity pricing. Companies now pay more if you have more dashboards, apps, and reports. Earlier, we spoke about dependencies. Keeping redundant assets increases the number of dependencies and therefore the complexity. This comes with a price tag.
The implications of asset failures differ, and the business’s repercussions can be minimal or drastic.
Different industries have distinct regulatory requirements to meet. The impact may be minimal if a report for an end-of-year close has a mislabeled column that the sales or marketing department uses, On the other hand, if a healthcare or financial report does not meet the needs of a HIPPA or SOX compliance report, the company and its C-level suite may face severe penalties and reputational damage. Another example is a report that is shared externally. During an update of the report specs, the low-level security was incorrectly applied, which caused people to have access to personal information.
The complexity of assets influences their likelihood of encountering issues.
The last thing a business wants is for a report or app to fail at a crucial moment. If you know the report is complex and has a lot of dependencies, then the probability of failure caused by IT changes is high. That means a change request should be taken into account. Dependency graphs become important. If it is a straightforward sales report that tells notes by salesperson by account, any changes made do not have the same impact on the report, even if it fails. BI operations should treat these reports differently during change.
Not all reports and dashboards fail the same; some reports may lag, definitions might change, or data accuracy and relevance could wane. Understanding these variations aids in better risk anticipation.

Marketing uses several reports for its campaigns – standard analytic assets often delivered through marketing tools. Finance has very complex reports converted from Excel to BI tools while incorporating different consolidation rules. The marketing reports have a different failure mode than the financial reports. They, therefore, need to be managed differently.

It’s time for the company’s monthly business review. The marketing department proceeds to report on leads acquired per salesperson. Unfortunately, half the team has left the organization, and the data fails to load accurately. While this is an inconvenience for the marketing group, it isn’t detrimental to the business. However, a failure in financial reporting for a human resource consulting firm with 1000s contractors that contains critical and complex calculations about sickness, fees, hours, etc, has major implications and needs to be managed differently.

Acknowledging that assets transition through distinct phases allows for effective management decisions at each stage. As new visualizations are released, the information leads to broad use and adoption.
Think back to the start of the pandemic. COVID dashboards were quickly put together and released to the business, showing pertinent information: how the virus spreads, demographics affected the business and risks, etc. At the time, it was relevant and served its purpose. As we moved past the pandemic, COVID-specific information became obsolete, and reporting is integrated into regular HR reporting.
Reports and dashboards are crafted to deliver valuable insights for stakeholders. Over time, though, the worth of assets changes.
When a company opens its first store in a certain area, there are many elements it needs to understand – other stores in the area, traffic patterns, pricing of products, what products to sell, etc. Once the store is operational for some time, specifics are not as important, and it can adopt the standard reporting. The tailor-made analytic assets become irrelevant and no longer add value to the store manager.