
Analytics and Sarbanes-Oxley
Managing SOX compliance with self-service BI tools like Qlik, Tableau and PowerBI
Next year SOX will be old enough to buy beer in Texas. It was birthed out of the “Public Company Accounting Reform and Investor Protection Act”, affectionately known thereafter by the names of the senators who sponsored the bill, the Sarbanes-Oxley Act of 2002.  Sarbanes-Oxley was the offspring of the Securities Act of 1933 whose chief purpose was to protect investors from fraud by providing transparency into corporate finances. As that act’s progeny, Sarbanes-Oxley reinforced those aims and attempted to promote accountability through good business practices. But, like many young adults, we’re still trying to figure it out. Twenty years on, companies are still trying to figure out what the act’s implications are for them specifically, as well as, how best to build increased transparency into their technology and systems to support compliance.
Who is responsible?
Contrary to popular belief, Sarbanes-Oxley does not apply only to financial institutions, or only to the finance department. Its goal is to provide greater transparency into all organizational data and related processes. Technically, Sarbanes-Oxley applies only to publicly traded corporations, but its requirements are sound for any well-run business. The Act makes the CEO and CFO personally accountable for the  data presented. These officers rely, in turn, on the CIO, CDO and CSO to ensure that the data systems are secure, have integrity and are able to provide information necessary to prove compliance. Recently, control and compliance have become more of a challenge for CIOs and their peers. Many organizations are moving away from traditional enterprise, IT-managed Analytics and Business Intelligence systems. Instead, they’re adopting line-of-business-led self-service tools like Qlik, Tableau and PowerBI. These tools, by design, are not managed centrally.
Change Management
One of the key requirements for compliance with the Act is to define the controls in place and how changes in data or applications should be systematically recorded. In other words, the discipline of Change Management. Security, data and software access need to be monitored, as well as, whether IT systems are not functioning properly. Compliance depends on not just defining the policies and processes to safeguard the environment, but also to actually do it and ultimately be able to prove that it has been done. Just like police evidence chain of custody, compliance with Sarbanes-Oxley is only as strong as its weakest link.
The Weak Link
As an analytics evangelist, it pains me to say this, but the weakest link in Sarbanes-Oxley compliance is often Analytics or Business Intelligence. The leaders in self-serve Analytics mentioned above –Qlik, Tableau and PowerBI – Analysis and reporting today is more 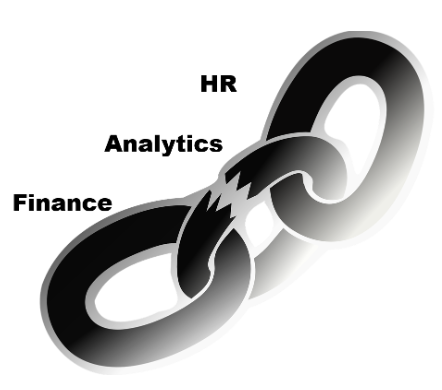 commonly done in line-of-business departments than in IT. This is even more true of Analytics tools like Qlik, Tableau and PowerBI which have perfected the self-service BI model. Most money spent on compliance has focused on financial and accounting systems. More recently, companies have rightly expanded audit preparation to other departments. What they found was that formal IT Change Management programs had failed to encompass databases or data warehouses/marts with the same rigor used for applications and systems. The Change Management policies and procedures area of compliance falls under General Controls and is grouped with other IT policies and procedures of testing, disaster recovery, backup, and recovery and security.
Of the many steps required to comply with an audit, one of the things most often overlooked is to: “Keep an activity trail with real-time auditing, including a who, what, where and when of all operator activity and infrastructure changes, especially those that could be inappropriate or malicious.” Whether the change is to system settings, a software application, or data itself, a record must be maintained which contains, at minimum the following elements:
- Who requested the change
- When the change was performed
- What the change is – a description
- Who approved the change
Recording this information about changes to reports and dashboards in your Analytics and Business Intelligence systems are just as important. Regardless of where the Analytics and BI tool is on the continuum of control – the Wild West, self-service, or centrally managed; whether spreadsheets (shudder), Tableau/Qlik/Power BI, or Cognos Analytics – to be in compliance with Sarbanes-Oxley, you’ll need to be recording this basic information. The auditor doesn’t care if you’re using pen and paper or an automated system to document that your control processes are being followed. I concede that if you’re using spreadsheets as your “analytics” software to make business decisions, you might also be using spreadsheets to record the change management.
However, chances are good that if you’ve already invested in an analytics system like PowerBI, or others, you should be looking for ways to automate recording the changes in your business intelligence and reporting system. As good as they are, out-of-the-box, analytics tools like Tableau, Qlik, PowerBI have neglected to include easy, auditable change management reporting. Do your homework. Find a way to automate the documentation of changes to your analytics environment. Even better, be prepared to present to an auditor, not just a log of changes to your system, but that the changes conform to approved internal policies and processes.
Having the ability to:
1) demonstrate that you have solid internal policies,
2) that your documented processes support them, and
3) that actual practice can be confirmed
will make any auditor happy. And, everybody knows that if the auditor is happy, everybody’s happy.
Many companies complain about the added costs of compliance, and the cost of compliance with SOX standards can be high. “These costs are more significant for smaller firms, for more complex firms, and for firms with lower-growth opportunities.” The cost for non-compliance can be even higher.
The Risk of Non-Compliance
Sarbanes-Oxley holds CEOs and directors accountable and punishable by up to $500,000 and 5 years in prison. The government does not often accept a plea of ignorance or incompetence. If I were a CEO, I would surely want my team to be able to prove that we had adhered to best practices and we knew who had performed every transaction.
One more thing. I said that Sarbanes-Oxley is for publicly traded companies. That’s true, but consider how the lack of internal controls and lack of documentation might hinder you if you ever wanted to make a public offering.