Post: LDAP and Active Directory Support in MotioPI

In Cognos environments which authenticate against LDAP or Active Directory, MotioPI can be configured to pull information directly from the external security provider. This enables some of the advanced features in the User Access panel without requiring a stored credential for each user.

Luckily, MotioPI can easily pull LDAP / Active Directory configuration information directly from your cogstartup.xml file. This is the file which stores all selections made in the Cognos Configuration UI – its located in your Cognos installation folder at <cognos-install-root>/configuration/cogstartup.xml ).

This blog entry will walk you through the steps required to tell MotioPI about your LDAP or Active Directory instance.

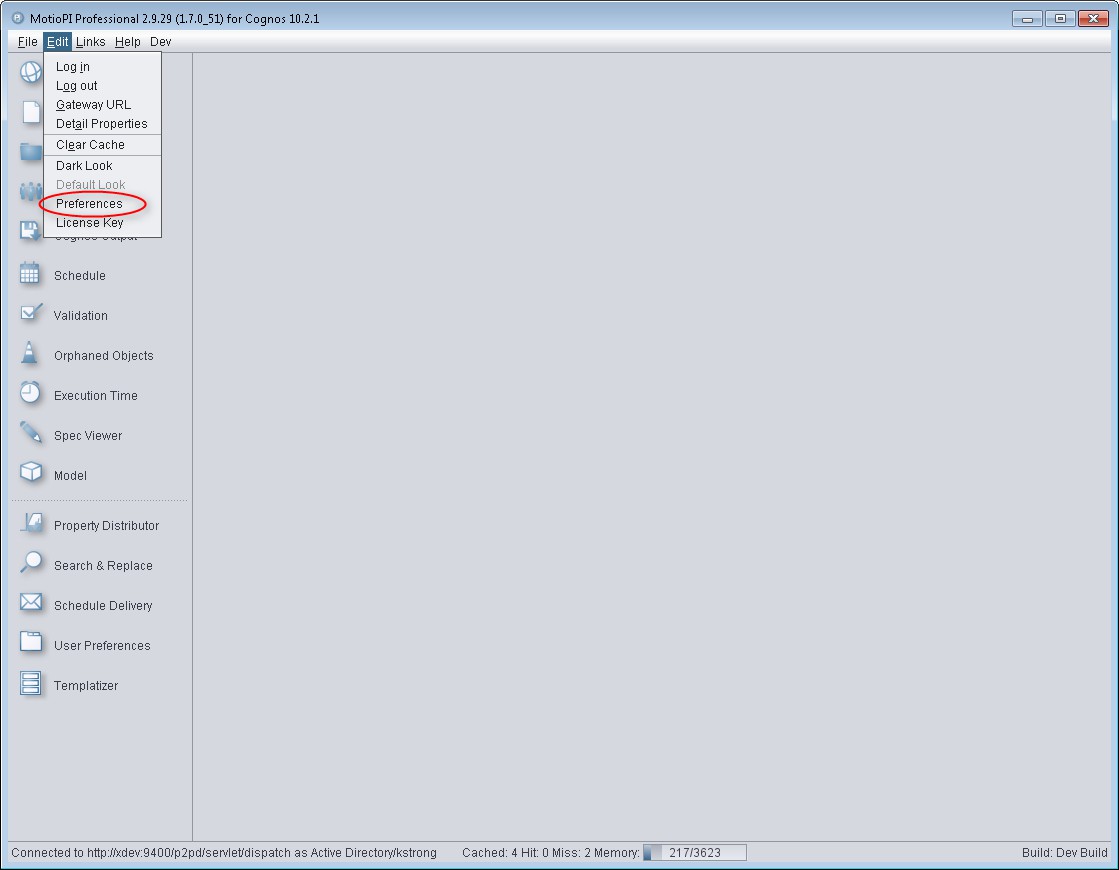
1. First go to File -> Preferences

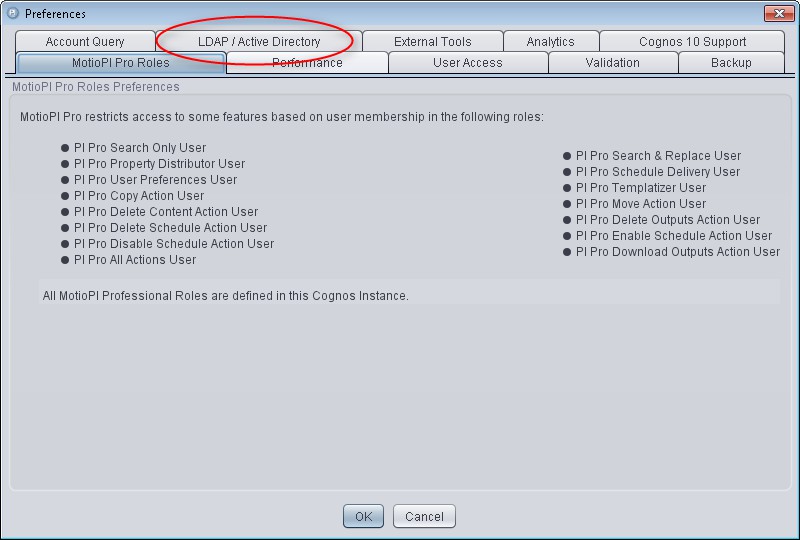
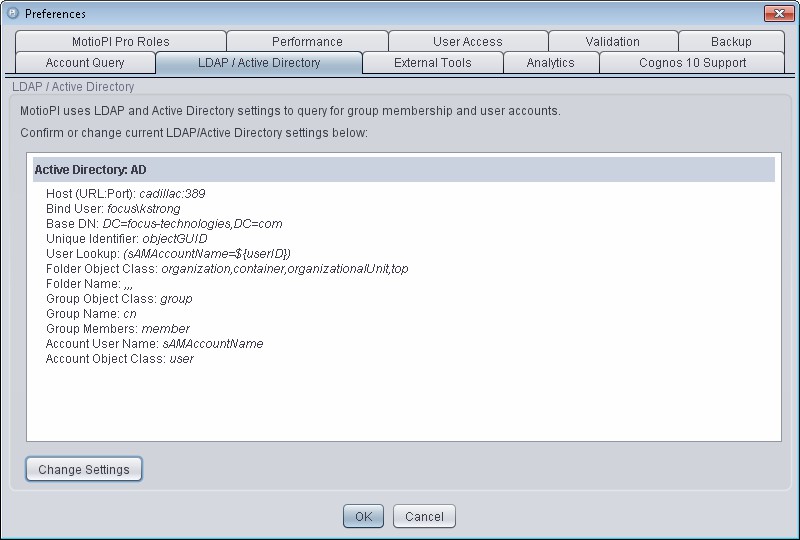
2. Now select the LDAP/Active Directory Tab

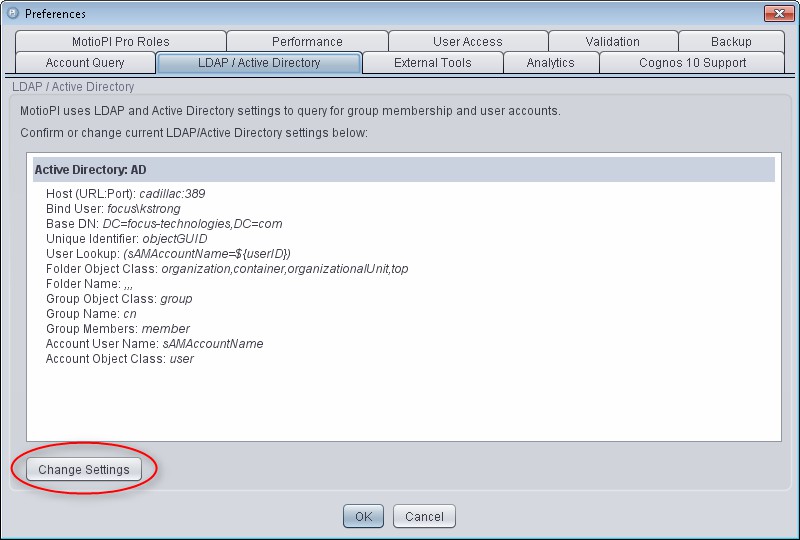
3. To edit the settings, click the Change Settings button

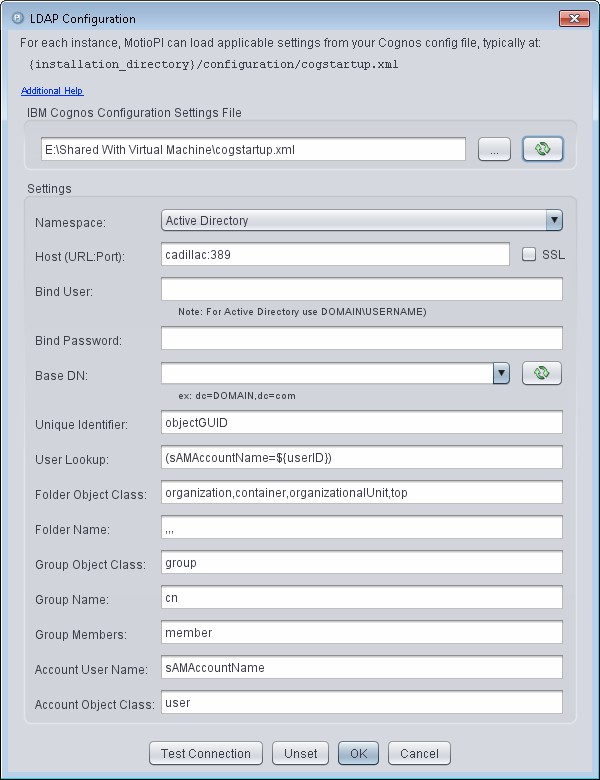
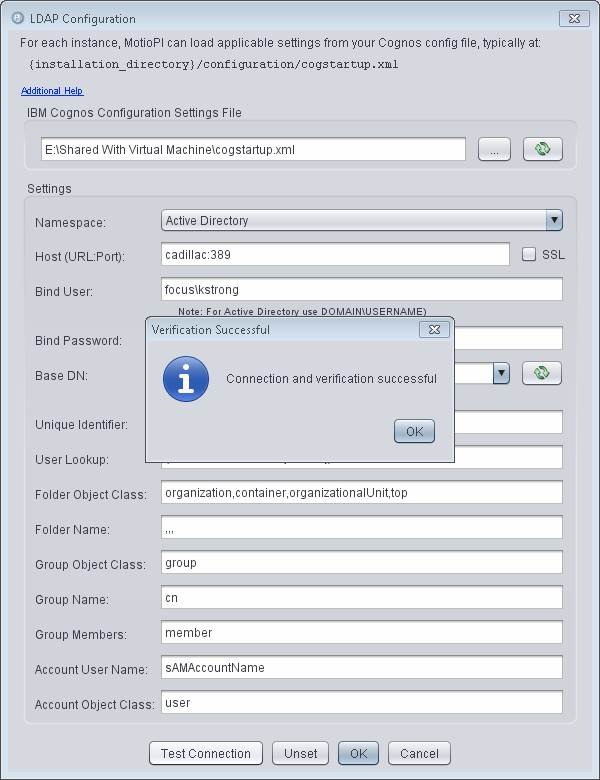
4. Now you need to fill in your settings. This is where the cogstartup.xml comes in handy. Grab the cogstartup.xml file from your Cognos server and save it locally. Then use the “…” button to point MotioPI at the cogstartup.xml file. Click on the refresh button, and MotioPI will populate the LDAP / AD settings on this screen based on the values stored in cogstartup.xml.

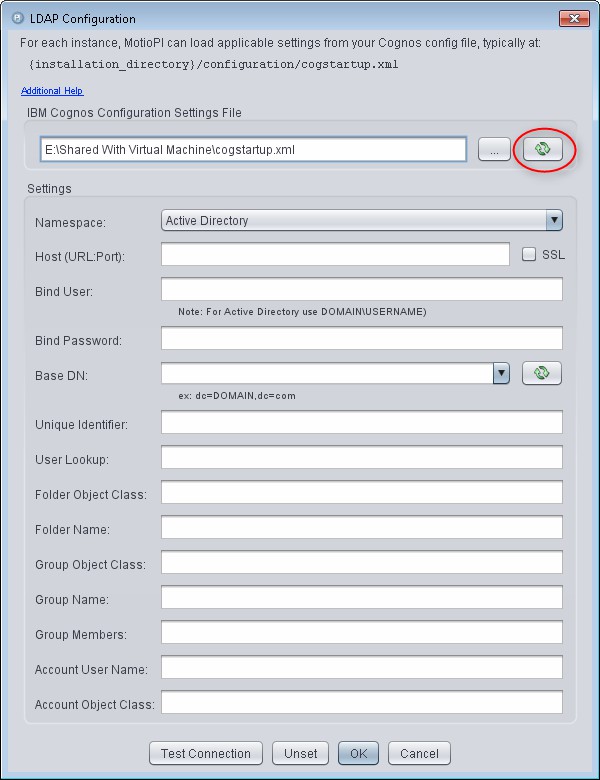
5. You will now see most of your settings filled in

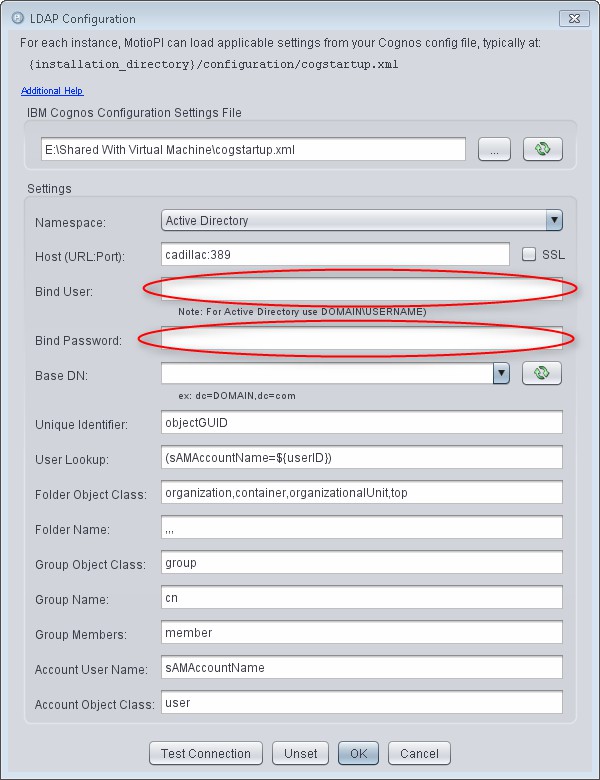
6. Next you’ll need to fill in your Bind User and Bind Password. These cannot be gleaned from cogstartup.xml since they are stored in encrypted format.

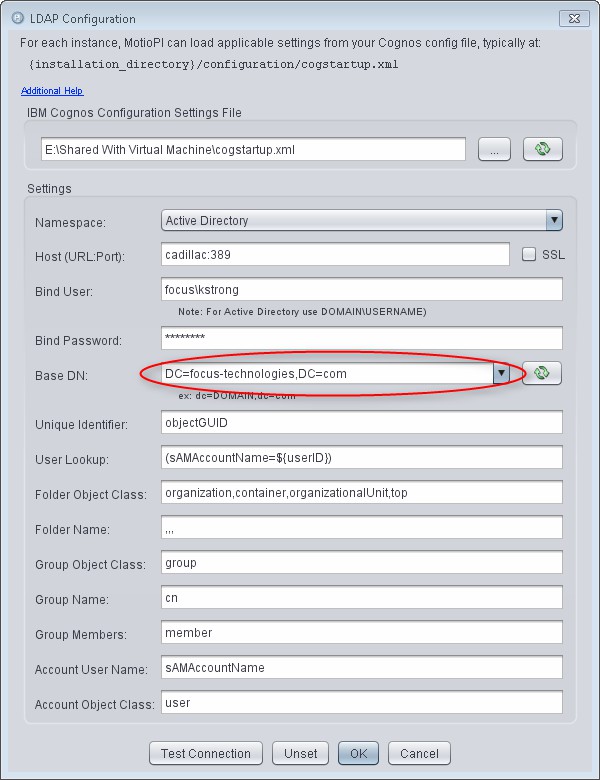
7. Once you have the Bind User / Password filled in, click the refresh button for Base DN and it will populate for you.

8. You can now test your connection, by clicking Test Connection

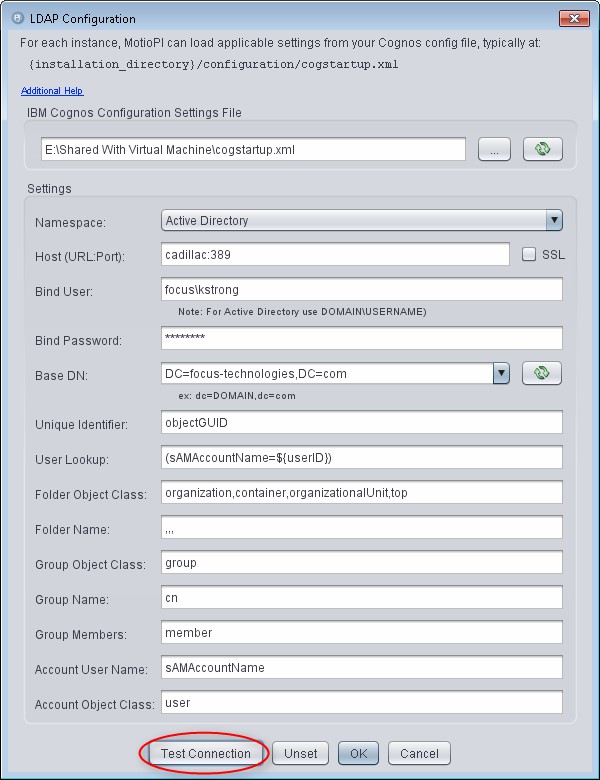
9. You will then see a message indicating that the test was successful.

10. Now click OK to save the settings.

11. You will now see your settings saved. Click OK to complete your changes.


To complete the connection, click on the Account Query tab. In the lower section select the LDAP/AD radio button, then click ok. MotioPI will now query directly to your LDAP or AD.

That’s it. Now MotioPI knows how to talk directly to your LDAP or Active Directory security provider.


Scroll to Top
As the BI space evolves, organizations must take into account the bottom line of amassing analytics assets.
The more assets you have, the greater the cost to your business. There are the hard costs of keeping redundant assets, i.e., cloud or server capacity. Accumulating multiple versions of the same visualization not only takes up space, but BI vendors are moving to capacity pricing. Companies now pay more if you have more dashboards, apps, and reports. Earlier, we spoke about dependencies. Keeping redundant assets increases the number of dependencies and therefore the complexity. This comes with a price tag.
The implications of asset failures differ, and the business’s repercussions can be minimal or drastic.
Different industries have distinct regulatory requirements to meet. The impact may be minimal if a report for an end-of-year close has a mislabeled column that the sales or marketing department uses, On the other hand, if a healthcare or financial report does not meet the needs of a HIPPA or SOX compliance report, the company and its C-level suite may face severe penalties and reputational damage. Another example is a report that is shared externally. During an update of the report specs, the low-level security was incorrectly applied, which caused people to have access to personal information.
The complexity of assets influences their likelihood of encountering issues.
The last thing a business wants is for a report or app to fail at a crucial moment. If you know the report is complex and has a lot of dependencies, then the probability of failure caused by IT changes is high. That means a change request should be taken into account. Dependency graphs become important. If it is a straightforward sales report that tells notes by salesperson by account, any changes made do not have the same impact on the report, even if it fails. BI operations should treat these reports differently during change.
Not all reports and dashboards fail the same; some reports may lag, definitions might change, or data accuracy and relevance could wane. Understanding these variations aids in better risk anticipation.

Marketing uses several reports for its campaigns – standard analytic assets often delivered through marketing tools. Finance has very complex reports converted from Excel to BI tools while incorporating different consolidation rules. The marketing reports have a different failure mode than the financial reports. They, therefore, need to be managed differently.

It’s time for the company’s monthly business review. The marketing department proceeds to report on leads acquired per salesperson. Unfortunately, half the team has left the organization, and the data fails to load accurately. While this is an inconvenience for the marketing group, it isn’t detrimental to the business. However, a failure in financial reporting for a human resource consulting firm with 1000s contractors that contains critical and complex calculations about sickness, fees, hours, etc, has major implications and needs to be managed differently.

Acknowledging that assets transition through distinct phases allows for effective management decisions at each stage. As new visualizations are released, the information leads to broad use and adoption.
Think back to the start of the pandemic. COVID dashboards were quickly put together and released to the business, showing pertinent information: how the virus spreads, demographics affected the business and risks, etc. At the time, it was relevant and served its purpose. As we moved past the pandemic, COVID-specific information became obsolete, and reporting is integrated into regular HR reporting.
Reports and dashboards are crafted to deliver valuable insights for stakeholders. Over time, though, the worth of assets changes.
When a company opens its first store in a certain area, there are many elements it needs to understand – other stores in the area, traffic patterns, pricing of products, what products to sell, etc. Once the store is operational for some time, specifics are not as important, and it can adopt the standard reporting. The tailor-made analytic assets become irrelevant and no longer add value to the store manager.