Post: Locate and Mass Update Fonts in ALL your Cognos Reports, Quickly and Easily

Imagine your organization has decided to update their brand, and you’re tasked with updating the fonts on ALL company-wide reports that aren’t Arial or Helvetica with Arial. But how would you proceed to accomplish this herculean task? The average Cognos customer has between 10,00 and 15,000 reports in their production environment. So you would have to dive into tens of thousands of reports and manually edit each and every one! MotioPI Pro provides a more efficient method for mass updating all your Cognos BI content. Here is a look into how to update your fonts.

What are regular expressions

A regular expression (regex or regexp) is a special text string that can help you match, locate, and manage text. Regular expressions may seem puzzling at first glance, but once mastered you can save hundreds of hours by avoiding the tedious process of manually searching for text. Here, I will show you how to use MotioPI Pro Search & Replace panel to find all fonts with the exclusion of Arial and Helvetica and update your fonts to be Arial.

Using Search & Replace Panel

The Search & Replace panel allows you to mass update content within the Content Store (reports, queries, analysis objects, etc.) and outside the Content Store (XML files, CPF files, etc.). To begin, open MotioPI Pro.

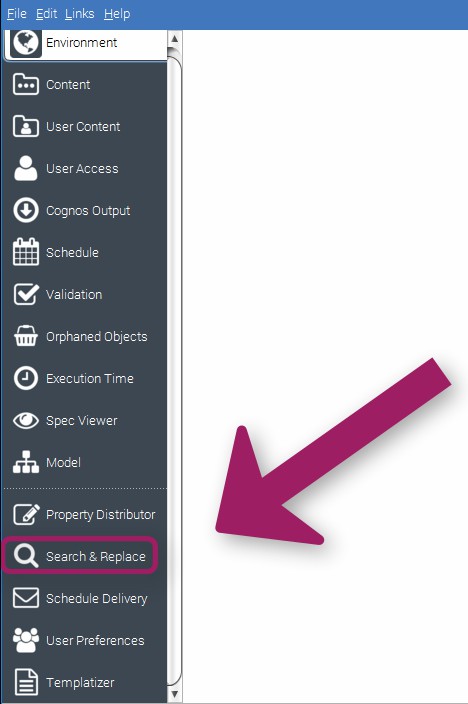
1. Click on the “Search & Replace” located on the left-hand panel.

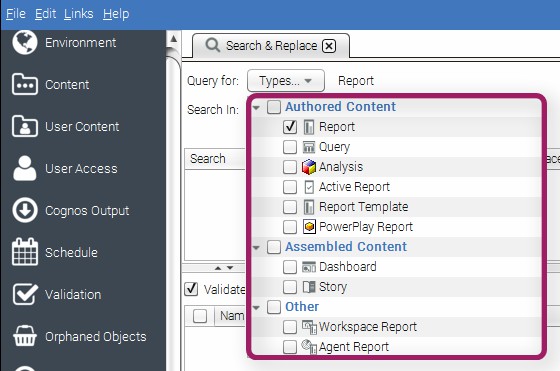
2. Under the “Search & Replace” tab, you will see the “Query for:” drop-down menu. Click on the drop-down menu and select “Report”. This drop-down menu will set the type of Cognos object that you want to examine in MotioPI Pro.

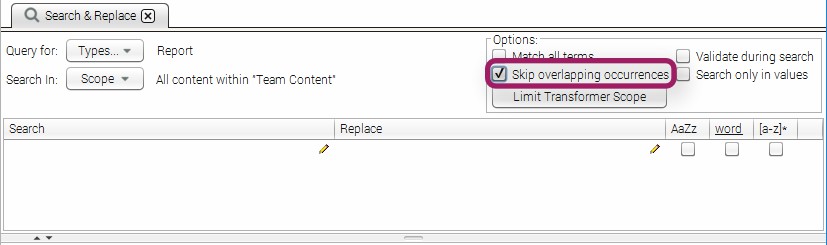
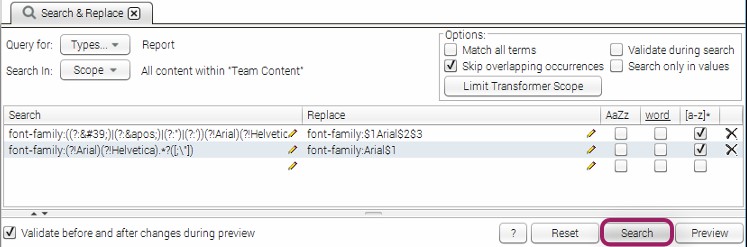
3. In the “Options” box, select “Skip overlapping occurrences”. This will provide us with a clear view of every original regular expression.

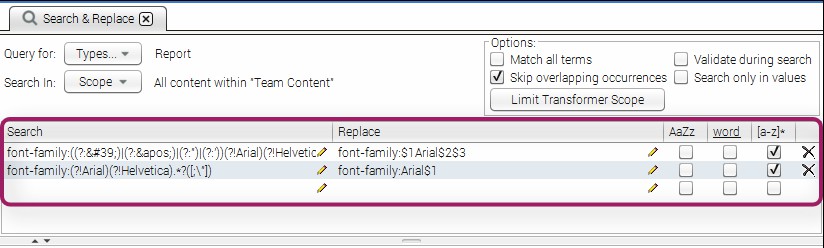
4. In the “Search” and “Replace” section, we will input the following commands:
*Make sure the regular expressions ([a-z]*) checkbox is selected.*

The first row will search for fonts within quotations and replace them with Arial font. The second row will replace fonts with Arial that are not already Arial with Helvetica. The brackets surrounding our search terms will be referenced and replaced by our replacement terms.

5. Below the “Search” and “Replace” columns, click on “Search” to locate all the reports that contain our search terms.

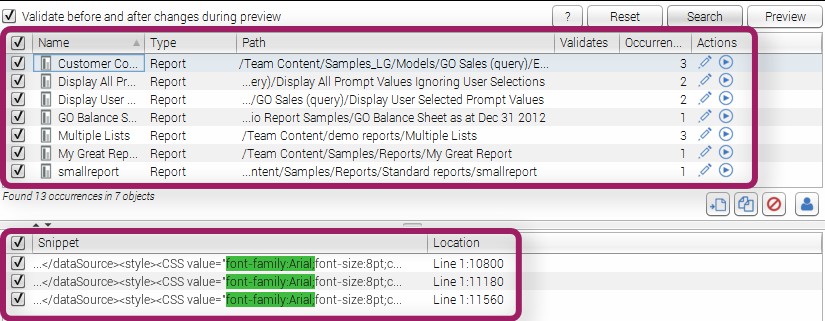
6. Once the search has been completed, click on the checkbox on the left of “Name” to select all your reports. Below, you can select an individual report to see a preview of the search terms and their locations.

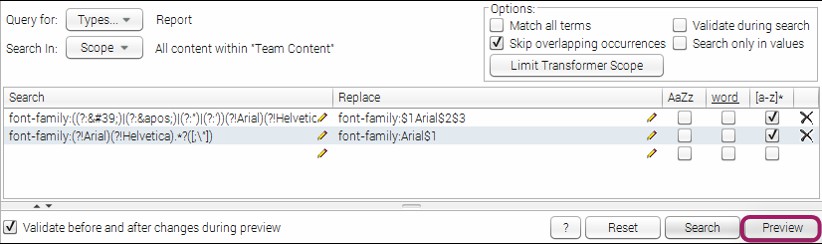
7. To begin replacing our search terms, select “Preview”.

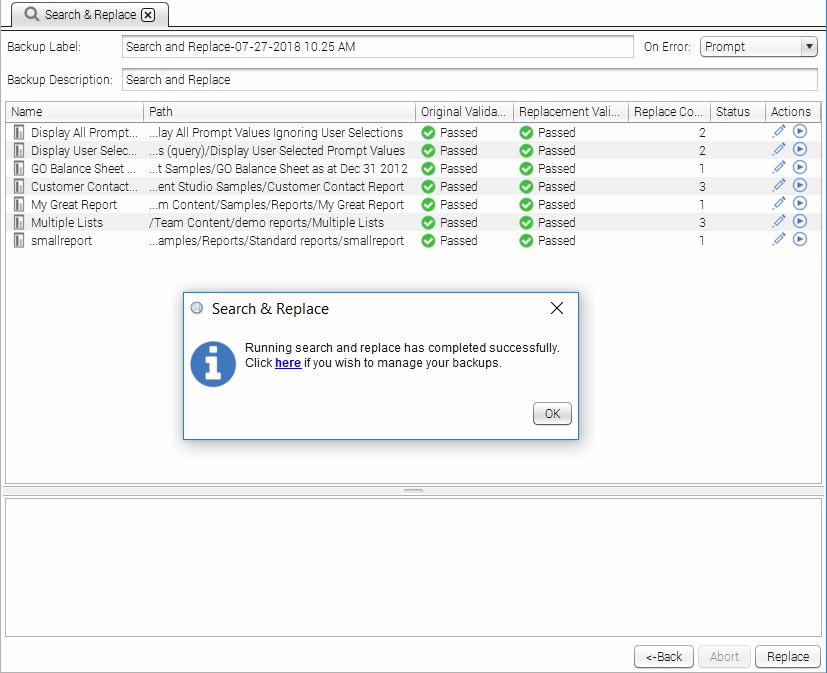
8. In the “Preview” window, you can double-check the changes before they are finalized to your reports. To confirm your changes, click on “Replace” in the bottom right corner.

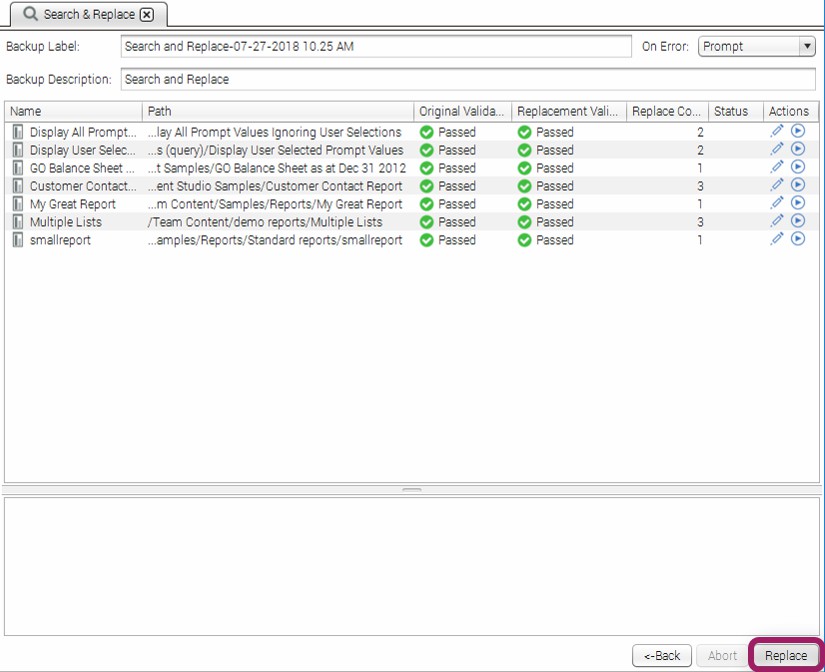
9. Now all of the reports that met the search criteria have been replaced with the Arial font.

Purchase MotioPI Pro directly on our website.

Scroll to Top
As the BI space evolves, organizations must take into account the bottom line of amassing analytics assets.
The more assets you have, the greater the cost to your business. There are the hard costs of keeping redundant assets, i.e., cloud or server capacity. Accumulating multiple versions of the same visualization not only takes up space, but BI vendors are moving to capacity pricing. Companies now pay more if you have more dashboards, apps, and reports. Earlier, we spoke about dependencies. Keeping redundant assets increases the number of dependencies and therefore the complexity. This comes with a price tag.
The implications of asset failures differ, and the business’s repercussions can be minimal or drastic.
Different industries have distinct regulatory requirements to meet. The impact may be minimal if a report for an end-of-year close has a mislabeled column that the sales or marketing department uses, On the other hand, if a healthcare or financial report does not meet the needs of a HIPPA or SOX compliance report, the company and its C-level suite may face severe penalties and reputational damage. Another example is a report that is shared externally. During an update of the report specs, the low-level security was incorrectly applied, which caused people to have access to personal information.
The complexity of assets influences their likelihood of encountering issues.
The last thing a business wants is for a report or app to fail at a crucial moment. If you know the report is complex and has a lot of dependencies, then the probability of failure caused by IT changes is high. That means a change request should be taken into account. Dependency graphs become important. If it is a straightforward sales report that tells notes by salesperson by account, any changes made do not have the same impact on the report, even if it fails. BI operations should treat these reports differently during change.
Not all reports and dashboards fail the same; some reports may lag, definitions might change, or data accuracy and relevance could wane. Understanding these variations aids in better risk anticipation.

Marketing uses several reports for its campaigns – standard analytic assets often delivered through marketing tools. Finance has very complex reports converted from Excel to BI tools while incorporating different consolidation rules. The marketing reports have a different failure mode than the financial reports. They, therefore, need to be managed differently.

It’s time for the company’s monthly business review. The marketing department proceeds to report on leads acquired per salesperson. Unfortunately, half the team has left the organization, and the data fails to load accurately. While this is an inconvenience for the marketing group, it isn’t detrimental to the business. However, a failure in financial reporting for a human resource consulting firm with 1000s contractors that contains critical and complex calculations about sickness, fees, hours, etc, has major implications and needs to be managed differently.

Acknowledging that assets transition through distinct phases allows for effective management decisions at each stage. As new visualizations are released, the information leads to broad use and adoption.
Think back to the start of the pandemic. COVID dashboards were quickly put together and released to the business, showing pertinent information: how the virus spreads, demographics affected the business and risks, etc. At the time, it was relevant and served its purpose. As we moved past the pandemic, COVID-specific information became obsolete, and reporting is integrated into regular HR reporting.
Reports and dashboards are crafted to deliver valuable insights for stakeholders. Over time, though, the worth of assets changes.
When a company opens its first store in a certain area, there are many elements it needs to understand – other stores in the area, traffic patterns, pricing of products, what products to sell, etc. Once the store is operational for some time, specifics are not as important, and it can adopt the standard reporting. The tailor-made analytic assets become irrelevant and no longer add value to the store manager.