When satisfying our cravings, few things can rival the joy of a piping hot slice of pizza. The debate between New York-style and Chicago-style pizza has sparked passionate discussions for decades. Each style has its own unique characteristics and devoted fans. Today, we’ll delve into the key differences between these two legendary pizza styles and explore the arguments for each. So, grab a slice and join us on this mouthwatering journey!
NY Style Pizza: A Thin Crust Delight 
New York-style pizza is renowned for its thin, foldable crust that delivers the perfect combination of chewiness and crispiness. Fans of NY-style pizza argue that its thin crust and quick preparation time make it the ideal choice for a fast and delicious meal. It’s perfect for the on-the-go eaters of NY. It’s the quintessential slice that captures the essence of the bustling city.
The crust is typically baked in industrial ovens at high temperatures, resulting in a shorter baking time (12-15 minutes). This quick bake helps achieve the signature leopard spots and slightly charred edges that add extra flavor to each bite.
Toppings on NY-style pizza are often smaller since the slices are generally larger, and one distinctive feature is the oil that surfaces at the top, giving the pizza its distinct sheen and enhancing the overall flavor.

Chicago Style Pizza: Deep-Dish Indulgence
If you’re looking for a pizza experience more like a hearty meal, Chicago-style pizza is the answer. Deep-dish delight boasts a thick crust baked in a pan, allowing for a generous amount of toppings and fillings. The cheese is layered directly on the crust, followed by fillings and a rich tomato sauce.
You have to keep your hunger in check regarding deep-dish pizza. Due to its thickness, Chicago-style pizza requires a longer baking time (45-50 minutes) to ensure the crust is perfectly golden and the fillings get cooked to perfection. The result is a satisfying, indulgent pizza experience that will leave begging for mercy.
Supporters of Chicago-style pizza praise its deep-dish structure and the substantial number of toppings. The layers of cheese, fillings, and sauce create a symphony of flavors in every bite. It’s a pizza that demands to be savored and enjoyed leisurely, perfect for a sit-down meal with friends and family.
Crunching the Crust: Pizza Statistics Revealed
- Three billion pizzas are sold every year in the United States worth over $46 billion
- Every second, an average of 350 slices are sold.
- Approximately 93% of Americans eat at least one pizza per month.
- On average, each person in America eats about 46 pizza slices a year.
- More than 41% of us eat pizza every week, with one in eight of all Americans eating pizza on any given day.
- The pizza industry sells more than $40 billion in products annually.
- Roughly 17% of all restaurants in the U.S. are pizzerias, with more than 10% of the country’s pizzerias located in NYC.
Source: https://zipdo.co/statistics/pizza-industry/
Regarding NY vs. Chicago-style pizza, the stats are less clear. We know from the Factual map below that was posted in The Washington Post that 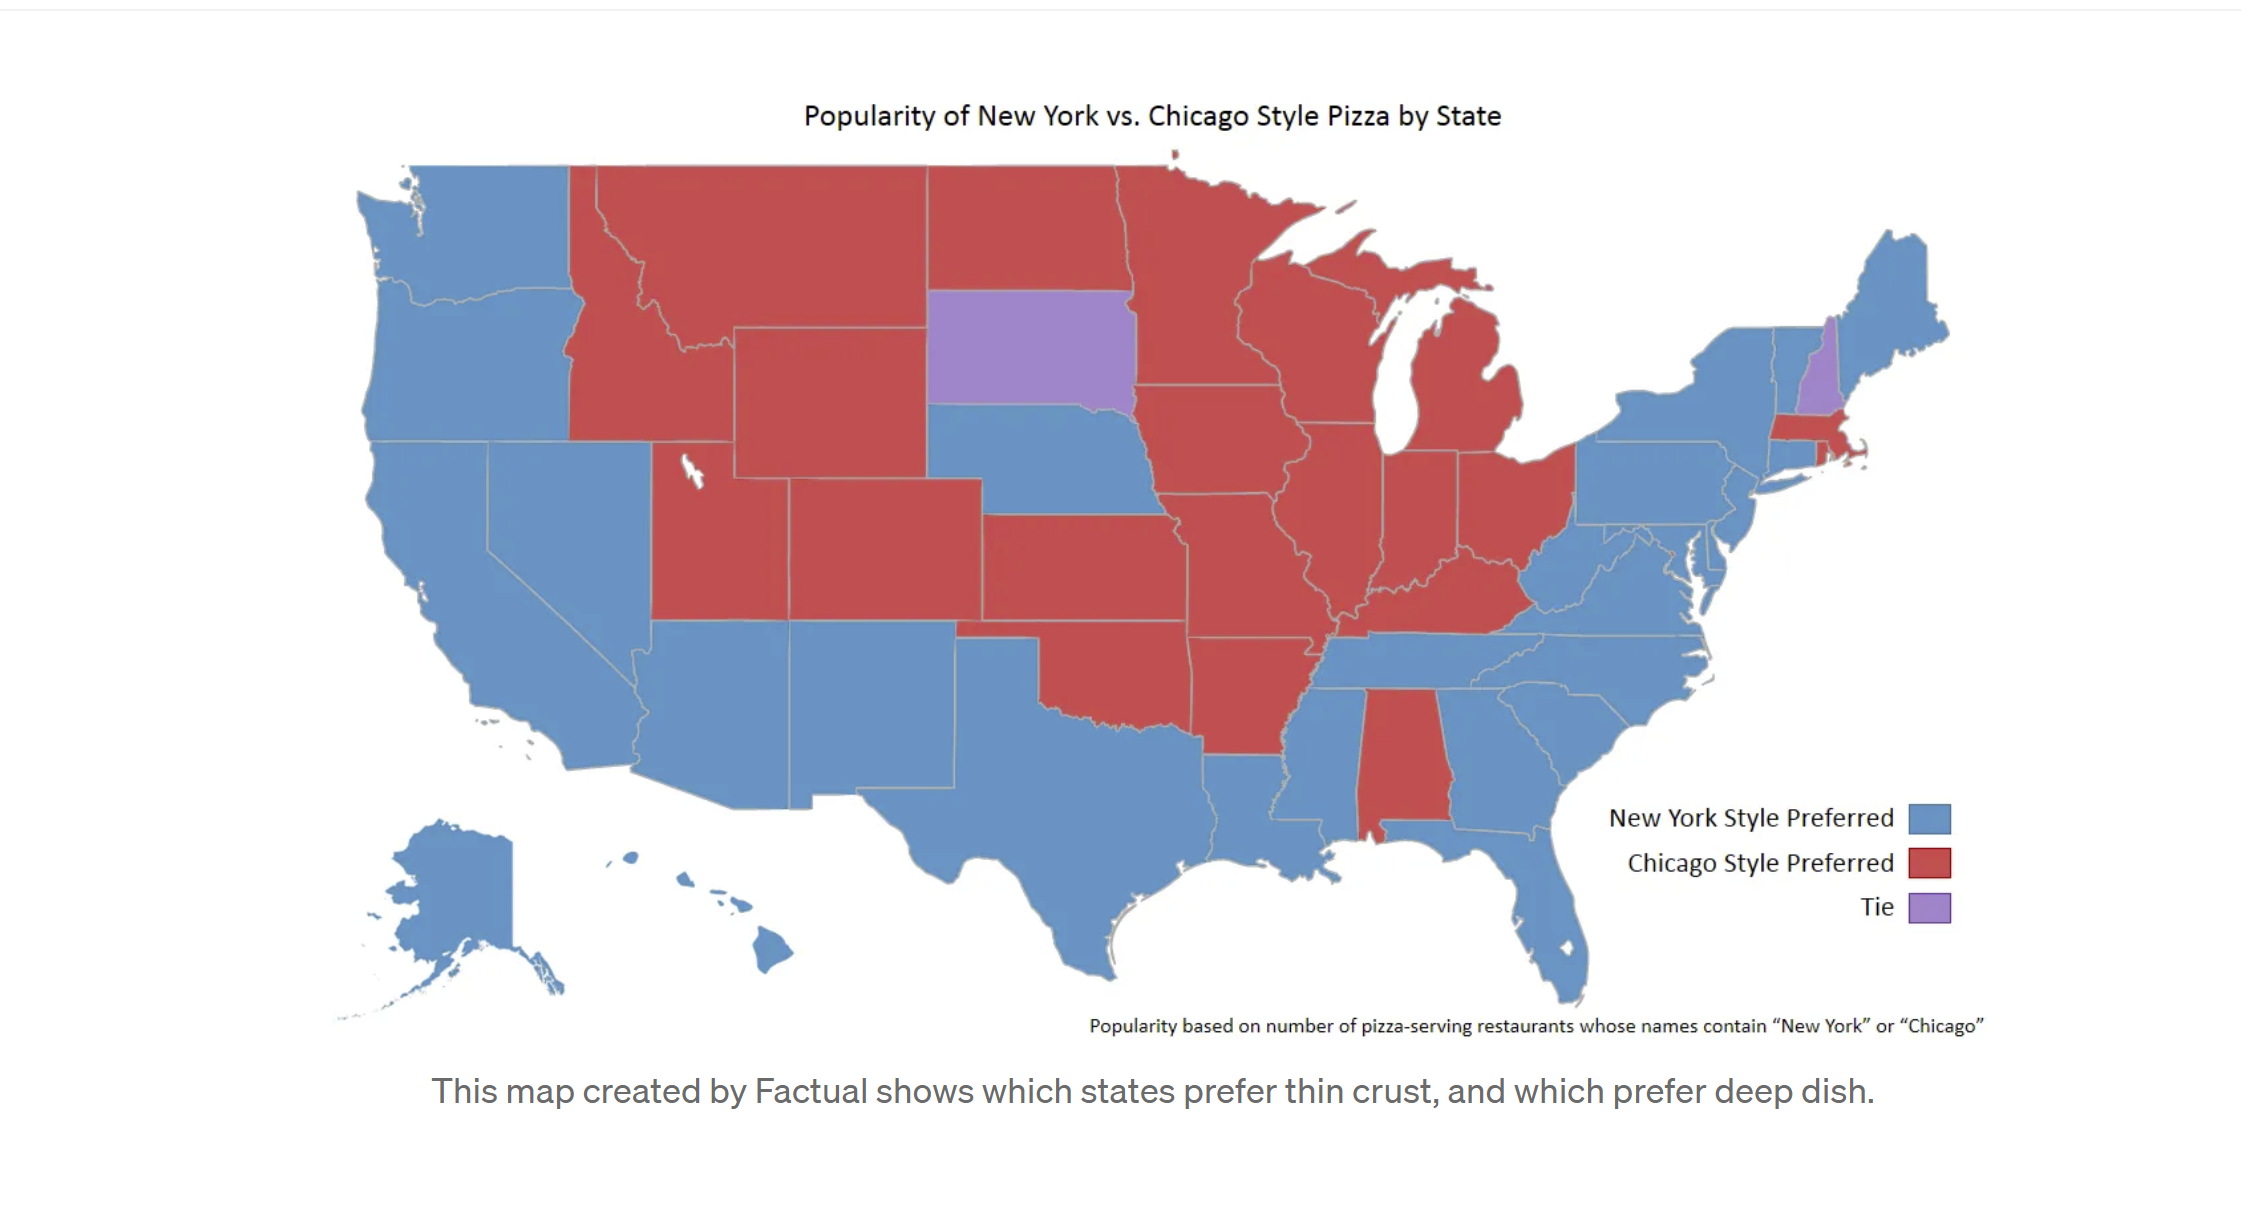
- New York style rules the coastal and southern states, while Chicago style holds fast in the middle of the country,”
- 27 states and Washington, D.C. prefer thin crust, compared to the 21 which prefer deep dish.
- Regular thin crust is most popular in America; it is preferred by 61% of the population, 14% prefer deep-dish, and 11% prefer extra thin-crust
- Approximately 214,001,050 Americans prefer thin crust (blue states), compared to the 101,743,194 Americans who prefer deep dish (red states).
Interestingly enough, New York and Illinois do not even make the top 10 US states that eat the most pizza (Source: https://thepizzacalc.com/pizza-consumption-statistics-2022-in-the-usa/)
- Connecticut 6. Delaware
- Pennsylvania 7. Massachusetts
- Rhode Island 8. New Hampshire
- New Jersey 9. Ohio
- Iowa 10. West Virginia
However, finding the actual number of pizzas sold in each style is impossible to find! We searched hundreds of different ways only to find that you can buy pizza online to ship to your house.
What we discovered by pizza style:
| Description | Chicago-Style | New York-Style |
|---|---|---|
| Number of Pizza Restaurants/City | 25% | 25% |
| Average Number Slices/14” Pizza | 8 | 10 |
| Average Slices Eaten/Person | 2 | 3 |
| Average Calories/Slice | 460 | 250 |
| Number of Pizza Consumed per Person/Year | 25.5 | 64.2 |
| Average Cost/ Large Cheese Pizza | $27.66 | $28.60 |
| Average Google Rating of Pizza | 4.53 | 4.68 |
Data Doesn’t Always Settle the Debate
We like to think data has all the answers, but when it comes to food, oftentimes, things are subjective. In the chart below, we outline “winning” criteria by pizza style.
| Winner | ||
|---|---|---|
| Category | Chicago-style | New York-style |
| Google Rating | 4.53 | 4.68 |
| Cost Large Cheese | $27.66 | $28.60 |
| Calories | 460 | 250 |
| Average Size | 12” | 18” |
| Crust | Thicker | Thinner |
| Toppings | Lots | Simpler |
| Oil | Less | Greasy |
| Slices | Rectangular | Triangular |
| Baking Time | 40-50 Minutes | 12-15 Minutes |
| Value (Calories/Dollar) | 133.04 | 87.41 |
As you can see there is no runaway winner. Even celebrities weigh in on the debate, and it really does come down to preference. Dave Portnoy, BarStool Sports (who’s never short on opinions) proclaimed a NY pizza “the best he’s ever had” (https://youtu.be/S7U-vROxF1w?si=1T3IZBnmgiCCn3I2) and then turns around and says deep-dish is the “Chicago go to” (https://youtu.be/OnORNFeIa2M?si=MXbnzdkplPyOXFFl)
So, if you’re in the mood for a quick slice or a large pizza and tend to rely on Google ratings, you might enjoy the New York-style pizza. However, if you value getting more bang for your buck in terms of calories, don’t have a problem with carbs, and don’t mind waiting a bit longer, you can’t go wrong with the Chicago-style pizza. Next time you’re craving a slice, try both styles and see which one wins your heart. And remember, no matter which style you prefer, pizza is always a delicious treat that’s worth the indulgence!