In the second half of the 2-part series on the importance of Business Intelligence tools, we’ll get into how an investment in BI software can prevent the costs associated with turnover and human resource mistakes.
If you are with a small or medium enterprise, you may believe that Business Intelligence is only for large, expansive organizations. Having experience in all sizes of these organizations, I can tell you frankly that every organization will benefit from implementing BI. They say the possibilities are endless with BI and it really is true.
The amount of questions that can be answered and created with BI can tell a small or medium business a very detailed story about what is really going on, why it’s happening. Many of the questions that a small business owner, managers, or even employees would ask themselves but can’t quite place their finger on to get the answers to. A lack of BI within a company can actually be quite costly to the business. How is that? Let me tell you a story…
A Widget Company Fires 3 Employees Based on Incorrect Data
 Let’s say there’s a small, family-owned widget company with 4 sites distributed over some small region. Although they don’t have formal BI in place, the P&Ls (Profits & Losses) show that there’s something funny that’s been happening with location #2. It has been open only a year, and sales have been very low. They are meeting only a few of the KPIs (Key Performance Indicators) that they have in place. Upon further investigation by the managers themselves, they don’t see anything wrong with the processes or the volume of inquiries. It looks like sales is the only place that is hurting, and it seems to be with a particular set of salespeople hired in when the facility opened. They assume the problem is the 3 salespeople, let them all go, and then decide to hire an all new sales team. This in turn creates high turnover costs. Six months later, nothing has changed except even lower sales from the training curve of the new salespeople.
Same Widget Company Scenario with BI in Place
 Well, let’s put BI in the picture for this story instead. Let’s say they track daily sales as well as track customer and employee satisfaction with a formal BI Tool. When a data analyst reviews daily sales reports, they seem to show a trend – some days, sales match perfectly with what is reported from other locations, but on an average of 3 out of 6 working days per week, sales drop significantly.
When the analyst looks at customer satisfaction and employee engagement surveys, it looks like the customers are happy with the service and pricing structure, but the employee engagement surveys for location #2 are dismal – not a lot of happy campers there like there are at the other 3 locations. What’s wrong? The compensation is the same, promotions are given out like candy to star employees… what is it? What is making them unhappy? What can you do to help, perhaps changing something as simple as their desk could make all the difference (they might work harder if they are sat on something like these pedastal corner desks). If you don’t know what the issue is, then you need to find out as soon as you can.
The analyst sees this and gets curious. He thinks of looking into another set of data to compare against sales- time cards. He runs a few correlations in SPSS to find out if there is a connection between attendance of any certain employees and sales. Interestingly enough, he sees that, over a period of a year, there is a significant correlation between the drop in sales on the days when a particular manager is present in location #2. The analyst presents his findings to the CEO.
Without a formal HR department, the CEO decides to visit location #2 and talks to each of the employees privately. It turns out, there’s a bad seed in management. This manager’s behavior toward employees has them even fearful to report the things that have happened. No one felt they could tell anyone what was occurring – who would they even report to, anyway? This small company doesn’t even have an HR department.
So, the sales decreases on the ~3 days per week were the days that the manager was on site. Although the employees hired always strived for excellence and wowed their customers, they were wrangling internally with the manager’s behavior toward them when he was on site, and sales plummeted. Consequently, the business took a hit which made having that location open unprofitable.
The Impact of no BI for this Widget Company
Human Resource Perspective:
The widget company turned 3 salespeople. Generally, one employee’s turnover costs can be equal to one year’s salary, which includes costs for ads, training, interviewing, learning curves, loss of knowledge, etc. Let’s say that an average salesperson’s salary here was $80K.
Business Perspective:
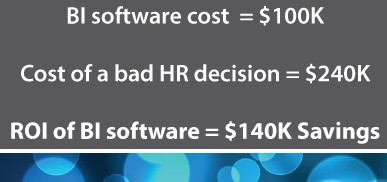
The estimated turnover costs for this scenario is $240K to the business. In a larger company, this number may be even higher if this manager had in turn caused even more employees to voluntarily leave the company.
If the cost for a BI tool was $100K and it avoids incorrect decisions like in the example costing $240K, then the company would have saved $140K by having the BI tool and not have let go 3 very talented salespeople from their team.
There are small and medium sized businesses all over the world who may have this same issue and would never even know that problems like these exist. Or at the very least, not know where to look and end up blaming the wrong people or processes. Even if a company has developed KPIs (Key Performance Indicators) and CSFs (Critical Success Factors), the failure to meet those factors only means so much when you don’t have BI to find not so obvious answers to those failures, like in the example above.
Implementing Business Intelligence assists not only in the speed of knowledge about what is going on in your business but also the speed in which something can be done. Whether it’s putting data in the hands of your employees to be able to make daily decisions or part of a larger strategic initiative for the company as a whole, BI will be able to help you increase productivity, communication, customer satisfaction, logistics improvements, and so much more.
Increases in productivity and satisfaction are very important to an organization’s success, especially when it is the productivity and satisfaction of the employees themselves. Employees have specific desires and needs for a company to allow their very special talents and abilities to shine, particularly the very significant desire and need of ensuring they have the tools they need to get their job done.