As a custom solutions shop that deals with IBM Cognos on a daily basis, one of the problems that comes up frequently is the integration of a specific report into an existing corporate web portal without involving Cognos Connection. Most commonly this is a dashboard which takes up a small portion of screen real estate in order to show something relevant to the rest of the page content or possibly something that has great importance and always needs to be in the user’s face. Typically this type of work fell to the Cognos SDK URL invocation. The Mashup Service gives us yet another approach to solve this sort of requirement.
There are a number of advantages to using the Cognos Mashup Service for such a task.
- It is relatively simple (compared to the URL invocation) and offers a complete end to end flow for these types of tasks
- It offers greater control of the user experience. For example often a cognos web session will time out resulting in the user being challenged for their cognos credentials inside the dashboard frame. This looks pretty tacky. Coding around in order to control flow is tricky. Ultimately using the Cognos Mashup Service allows a developer greater control of the outcome without having to worry about Cognos Connection bleeding into your dashboard
In order to make this sample more relevant, we will do a little role playing. We are developers for the venerable Great Outdoors sporting goods company. If you are reading this it is not likely to be a big stretch. Our CEO has requested that we construct an application for him so that he can monitor his key reports in the same page as his stock ticker and email. I picture the CEO of the Great Outdoors sporting goods company as a demanding J.Jonah Jameson type. Great Outdoors uses Google to host their corporate mail. After speaking with the CEO we also find out that he uses the iGoogle portal to consolidate personal data inside gadgets.
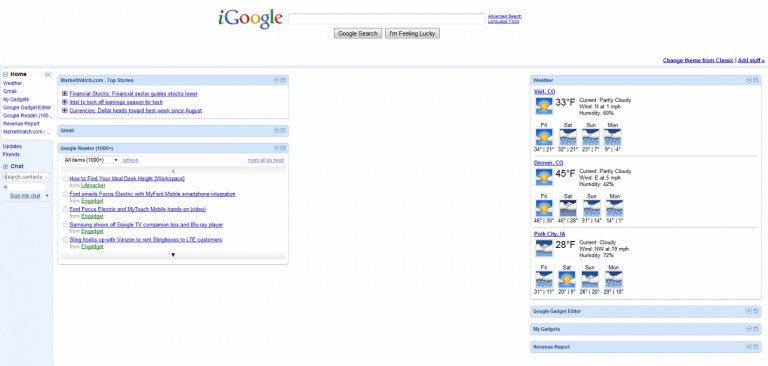
His page looks something like this:

Click Image to Enlarge
We leave breathing a sigh of relief. A great deal of the infrastructure has been provided by Google Gadgets. We have an ample section right in the middle of his page in which we can place our reporting gadget. This gives us a basic and somewhat realistic problem that can be solved through the Cognos Mashup Service.
Here is a diagram of what we have come up with for our solution’s basic architecture.

Click Image to Enlarge
To summarize the diagram above, we have the simplest of Google Gadgets to serve as a container for our dashboard report. The Gadget references a descriptor and page page which are hosted on our corporate web server. The web page contains all the logic that is required to interact with the Cognos Mashup Service in order to get the report output desired.
Playing the “at home” version of the game
The example application described below can be implemented by the reader with the appropriate version of Cognos and access to a development web server. There are a number items that will need to be localized from the generic example into the reader’s specific environment. If there is a call for the reader to make some change in their local environment it will be denoted in a “Bringing it Home” section. These sections look like this:
This is some information that will help localize the example to your environment if you wish to follow along
Let us start from the bottom up as we build our solution.
The Mashup Web Page
This is the bulk of our implementation, it performs the following tasks:
- Authenticates our user to the Cognos BI Server
- Invokes the relevant report and acquires the output
- Describes the detailed page layout
Mashup services reside as an extension of the cognos gateway. For example if my gateway is athttp://www.greatoutdoors.com/cognos/cgi-bin/cognos.cgi, then mashup services are found by adding the /rds resource to the gateway. The various functions of the mashup service are found by adding additional resources to the URL. For example the authentication service for login would be at the following URL:
http://www.greatoutdoors.com/cognos/cgi-bin/cognos.cgi/rds/auth/logon.
On a related note regarding using the mashup services – It is important to be consistent with the base URL and port for your AJAX mashup applications. This means that you should remove references to hard IP address and localhost. If you don’t then you’ll likely get silent failures where your application does not raise any errors but data just refuses to render. This is partly due to same site origin restrictions to prevent cross site scripting. Although there are some other reasons as well. It is best to just be consistent with your access to the service across all layers of your application and then you won’t have to worry about scratching your head when report data just refuses to render.
Authentication through Mashup Services
The code below implements a function for authenticating the user with Cognos. It builds an xml string containing the necessary namepace, userid, and password. Then kicks off an AJAX request pointed at the appropriate logon resource. If successful it sets a cookie in the browser and returns the response. The onFailure handler for this request contains a useful bit of mashup code which will tease out the error code via regular expressions. If you want just the error code independent of the whole string it is at index err[2].
1 2 3 4 5 6 7 8 9 10 11 12 13 14 15 16 17 18 19 20 21 22 23 24 25 26 27 28 29 30 31 32 |
function logon(aNamespace, aUserid, aPassword){ //build the xml credentials element var xmlData = "<credentials>" + "<credentialElements><name>CAMNamespace</name><label>Namespace:</label>" + "<value><actualValue>" + aNamespace + "</actualValue></value>" + "</credentialElements><credentialElements><name>CAMUsername</name><label>User ID:</label>" + "<value><actualValue>" + aUserid + "</actualValue></value>" + "</credentialElements><credentialElements><name>CAMPassword</name><label>Password:</label>" + "<value><actualValue>" + aPassword + "</actualValue></value>" + "</credentialElements></credentials>"; //authentication resource var rdsLogonUrl = cognosUrl + '/rds/auth/logon'; var request = new Ajax.Request(rdsLogonUrl,{ asynchronous : false, method : 'get', parameters :{ xmlData : xmlData }, onSuccess : function(aTransport) { return aTransport.responseText; }, onFailure : function(aTransport) { var regex = /(RDS-ERR-)(d*)/; var err = aTransport.responseText.match(regex); if (err != null) { alert(aTransport.responseText); } }); }
|
Running the report and getting the output
Now that our identity with Cognos has been established it is time to rustle up some some report data. This follows the same idiom as the logon method as far as building the URL and sending it to the Cognos gateway through an AJAX request.
The resource used to run a report by virtue of specifying its path is:
<gateway_url>/rdl/reportData/path/<report_path> ; where the appropriate gateway_url is substituted in as well as the logical path for the report that one would like to execute in place of <report_path>. Now, it is important to note that this is not the xpath based search path expression. Rather when it comes to Mashup services, path based report locations are identified in a directory fashion. For example, the report that the CEO is interested in seeing on his dashboard is located at /Public Folders/GO Sales and Retailers/Report Studio Report Samples/Global Sales.
The parameters section of this request is worth a look. The “fmt” property has been set to ‘HTML’ signifying that we want this output returned in HTML. By default the Mashup service returns LDX (an xml representation of the data). In this case HTML is closest to the report studio version of the report and that is what our CEO is used to seeing. So we’ll go with that.
The ‘selection’ property of the request allows us to cherry pick a portion of a report and ignore the rest. In this case there is a bar chart containing all of the information that the CEO requires on his dashboard. The value for this selection property can be found by examining the report in Report Studio and finding the Miscellaneous Properties::name property of the relevant object.
The ‘async’ property indicates whether or not the request to the mashup services should block until complete or return a reference to the request which can be polled periodically to see how it is doing. For the sake of simplicity this example will block until complete.
1 2 3 4 5 6 7 8 9 10 11 12 13 14 15 16 17 18 19 20 21 22 |
function getReportData(aReportPath){ var restPath = cognosUrl + '/rds/reportData/path' + aReportPath; var response; var request = new Ajax.Request(restPath,{ asynchronous : false, method : 'get', parameters :{ async : 'OFF', fmt : 'HTML' , selection : 'Combination Chart1' }, onSuccess : function(aTransport){ response = aTransport; }, onFailure : function(aTransport){ var regex = /(RDS-ERR-)(d*)/; var err = aTransport.responseText.match(regex); if (err != null){ alert(aTransport.responseText); }}}); return response; }
|
The return value from this request is the same HTML which would render if one were to type the full REST path on in a browser address bar. In this case the full URL would look like this:
http://www.greatoutdoors.com/cognos/cgi-bin/cognos.cgi/rds/reportData/path/Public%20Folders/GO%20Sales%20and%20Retailers/Report%20Studio%20Report%20Samples/Global%20Sales?async=OFF&fmt=HTML&selection=Combination%20Chart1
Adding the HTML Plating
The code below is the web page in its entirety. It adds the html body including an onLoad event listener to call the JavaScript function which performs our business logic yielding a chart which would look like this:
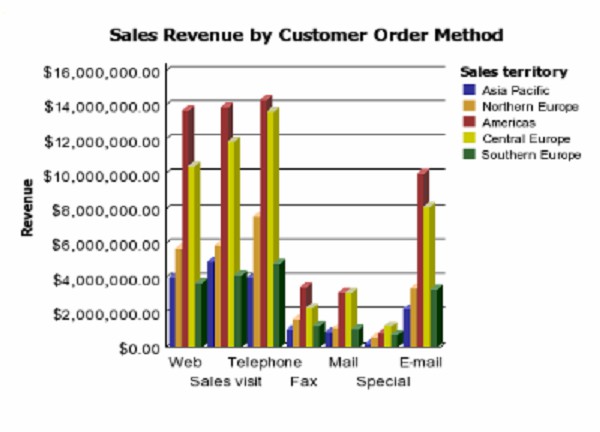
Click Image to Enlarge
1 2 3 4 5 6 7 8 9 10 11 12 13 14 15 16 17 18 19 20 21 22 23 24 25 26 27 28 29 30 31 32 33 34 35 36 37 38 39 40 41 42 43 44 45 46 47 48 49 50 51 52 53 54 55 56 57 58 59 60 61 62 63 64 65 66 67 68 69 70 71 72 73 74 75 76 77 78 79 80 81 82 83 84 85 86 87 88 89 90 91 92 93 94 |
<!DOCTYPE HTML PUBLIC "-//W3C//DTD HTML 4.01 Transitional//EN" "http://www.w3.org/TR/html4/loose.dtd"> <html> <head> <!--We are relying on prototype.js to make our lives easier. Get it from http://www.prototypejs.org/download--> <script type="text/javascript" src="js/prototype/prototype.js"></script> <style type="text/css"> #Combination__Chart1 { height: 250px; width: 400px; } </style> <script type="text/javascript"> //cognos base URL information var wsUrl = 'www.greatoutdoors.com'; var cognosUrl = 'http://' + wsUrl + '/cognos/cgi-bin/cognos.cgi'; //hard coded credentials var namespace = 'go'; var username = 'goceo'; var password = 'supersecret'; //dashboard report location var reportPath = '/Public Folders/GO Sales and Retailers/Report Studio Report Samples/Global Sales'; function logon(aNamespace, aUserid, aPassword) { //logon to cognos var xmlData = "<credentials>" + "<credentialElements><name>CAMNamespace</name><label>Namespace:</label>" + "<value><actualValue>" + aNamespace + "</actualValue></value>" + "</credentialElements><credentialElements><name>CAMUsername</name><label>User ID:</label>" + "<value><actualValue>" + aUserid + "</actualValue></value>" + "</credentialElements><credentialElements><name>CAMPassword</name><label>Password:</label>" + "<value><actualValue>" + aPassword + "</actualValue></value>" + "</credentialElements></credentials>"; var rdsLogonUrl = cognosUrl + '/rds/auth/logon'; //ajax provided by prototype.js var request = new Ajax.Request(rdsLogonUrl, { asynchronous : false, method : 'get', parameters :{ xmlData : xmlData }, onSuccess : function(aTransport) { return aTransport.responseText; }, onFailure : function(aTransport) { var regex = /(RDS-ERR-)(d*)/; var err = aTransport.responseText.match(regex); if (err != null) { alert(aTransport.responseText); } } }); } function runReport(){ logon(namespace, username, password); var response = getReportData(reportPath); var e = document.getElementById('report_body'); e.innerHTML = response.responseText; } function getReportData(aReportPath){ var restPath = cognosUrl + '/rds/reportData/path' + aReportPath; var response; var request = new Ajax.Request(restPath, { asynchronous : false, method : 'get', parameters :{ async : 'OFF', fmt : 'HTML' , selection : 'Combination Chart1' }, onSuccess : function(aTransport) { response = aTransport; }, onFailure : function(aTransport) { var regex = /(RDS-ERR-)(d*)/; var err = aTransport.responseText.match(regex); if (err != null) { alert(aTransport.responseText); } } }); return response; } </script> <title></title> </head> <body onload="runReport()"> <div id="report_body">Loading...</div> </body> </html>
|
You’ll need to change the following variables to values that are appropriate to your test environment
- wsUrl – base host name for your web server
- cognosUrl – the path to the cognos gateway
- namespace – security namespace containing your user
- username – the userid for your test user
- password – the password for for your test user
- reportPath – the logical directory path of your favorite report
- selection – if you would like to return the entire report then you can remove this variable
The Gadget Descriptor
This is a simple xml file that will be hosted on a web server which provides information about how the gadget will behave in the iGoogle portal. It also provides a reference to the actual web page which provides the mashup content. This file is deployed in the same directory as the mashup html/javascript web page. In this case our gadget descriptor will be located at:
http://www.greatoutdoors.com/dashboards/google-gadget-mashup.xml
If you are implementing this example you’ll need to change the href value to point to your own web page and save this content in an xml file next to your Mashup web page. If the report is out of bounds in your google gadget, then you can change the height attribute.
1 2 3 4 5 |
<?xml version="1.0" encoding="UTF-8"?> <Module> <ModulePrefs title="Revenue Report" height="300" /> <Content type="url" href="http://www.greatoutdoors.com/dashboards/revenue.html"></Content> </Module> |
The iGoogle portal
Now it is time to test your integrated solution in your own iGoogle portal. In the interest of keeping this article tightly focused on Cognos Mashup I will be as brief as possible on this topic.
- Point your browser to http://www.google.com
- Click on the iGoogle link in the upper right hand corner
- Click on the “Add Stuff >>”in the upper right quadrant of the page
- Click the “Add Feed or Gadget” link in the right most column.
- Enter the URL to your gadget descriptor and click Add. The URL of the gadget is a reference to the xml descriptor on your web server. For example;http://www.greatoutdoors.com/dashboards/google-gadget-mashup.xml You’ll likely get a warning that this was produced by someone other than Google. It is OK to ignore this since you are the producer.
- When you return to your iGoogle page you will now see your mashup gadget along with the existing gadgets.
Here is the finished product.
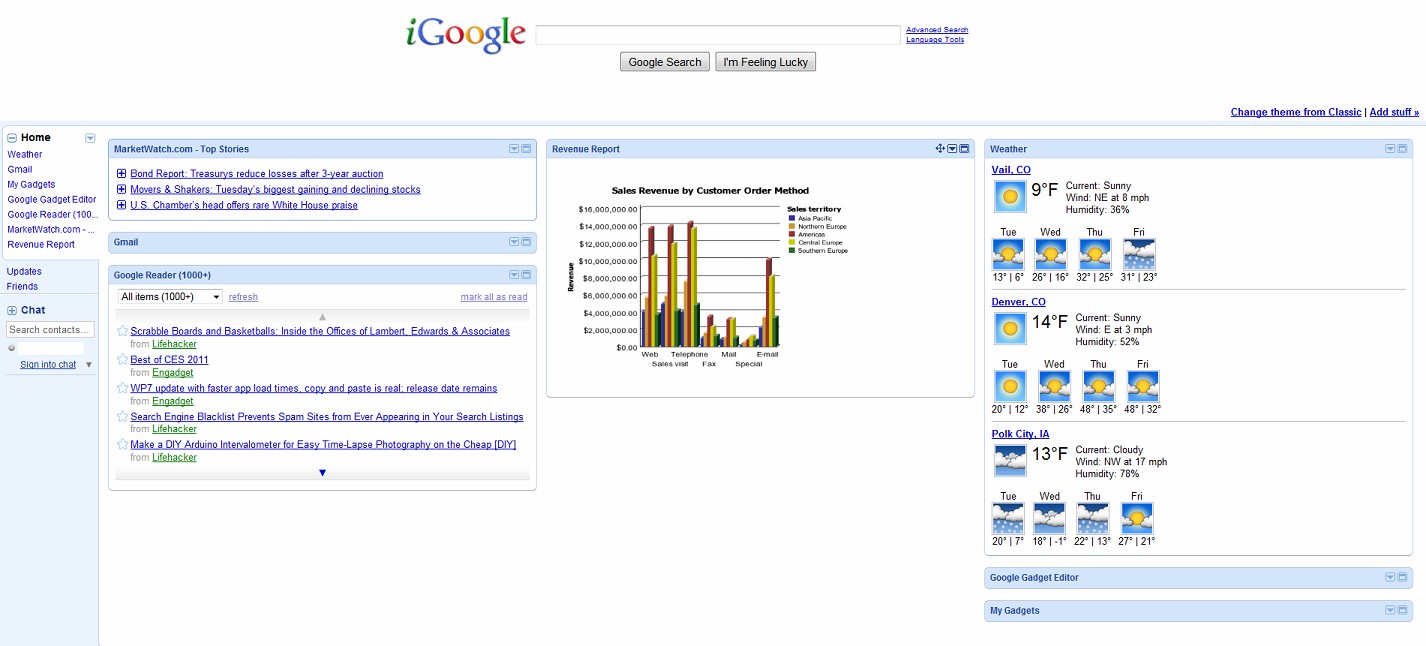
Click Image to Enlarge
Conclusion
A mere day later you walk into the CEO’s office and add your new dashboard gadget to his iGoogle portal. He responds, “What took you so long!”, then proceeds to give you the go ahead to continue to go forward and start enhancing this product. On the way out the door you catch the CEO’s reflection in the office door as he blinks and shakes his head in astonishment. He lets slip a barely audible whispered “Wow”.
You can now see that even the simplest use for consuming Cognos BI services can produce impressive results. Come back next time when we use the Cognos Mashup Service to produce pizza and beer out of thin air. Ok…that is simply not true, but I bet we’ll do something cool with it.
{{cta(‘7df2324d-a053-46bf-b4a3-adf18ca4e0db’)}}