How decentralized DAX development quietly fractures trust in enterprise analytics
TL;DR: Most Power BI trust problems don’t start with broken dashboards. They start with small, reasonable changes to business logic. One team changes the definition of “Active Customer,” another adjusts how profit is calculated, and a regional team applies its own currency conversion rule. Every choice makes sense locally, until the same KPI starts producing different numbers across reports. That’s semantic drift. Soterre exposes that drift inside the DAX, measures, assumptions, and business definitions before it turns into another boardroom argument over whose number is “right.”
Somewhere inside almost every mature Power BI environment lives a metric everyone is pretty sure they understand.
“Active Customer” is a popular candidate.
The definition sounds obvious until five departments define it five different ways:
- customers with a transaction in the last 12 months,
- customers active within 18 months,
- refunded purchases excluded,
- free-trial accounts included,
- inactive contracts filtered regionally,
- corporate adjustments applied quarterly.
Every dashboard still displays the same label:
Active Customers
Nobody notices the semantic drift immediately because each version evolved reasonably, one local business decision at a time.
That is how governance debt accumulates in modern analytics environments. Incrementally. Every calculation is defensible. Defensibly. Every team has a rationale. And eventually, expensively. Because none of the numbers match.
Self-Service BI Solved One Problem and Created Another
Power BI succeeded because it democratized analytics. It brought analytics down from the IT ivory tower to the masses. Business users no longer had to submit requests into centralized reporting queues and wait months for a new KPI or dashboard. Analysts closest to the business could move quickly, experiment, and deliver immediate value.
The velocity was transformative.
It also created an entirely new governance challenge.
As Power BI environments grow organically across departments, regions, and inherited development teams, semantic models begin to branch like unmanaged source code. Reports get copied. DAX measures get reused and modified locally. Temporary exceptions become permanent business rules. Developers inherit semantic logic from employees who left years earlier, often with little documentation beyond filenames like: Net_Profit_v3_REAL.pbix
At first, none of this feels dangerous. Zoom in, and every change appears rational. Zoom out, you can see a subtle drift. Metric drift starts as a development shortcut. Eventually, it reaches the boardroom.
The Exchange-Rate Problem
One of the most instructive examples I encountered involved currency conversion inside a global organization. I was working for a large equipment manufacturing company where I brought together a team of stakeholders to discuss their dashboards. I thought this would be very straightforward and budgeted half a day to agree on the business-level definitions of the KPIs. I figured, convert regional revenue into U.S. dollars and move on.
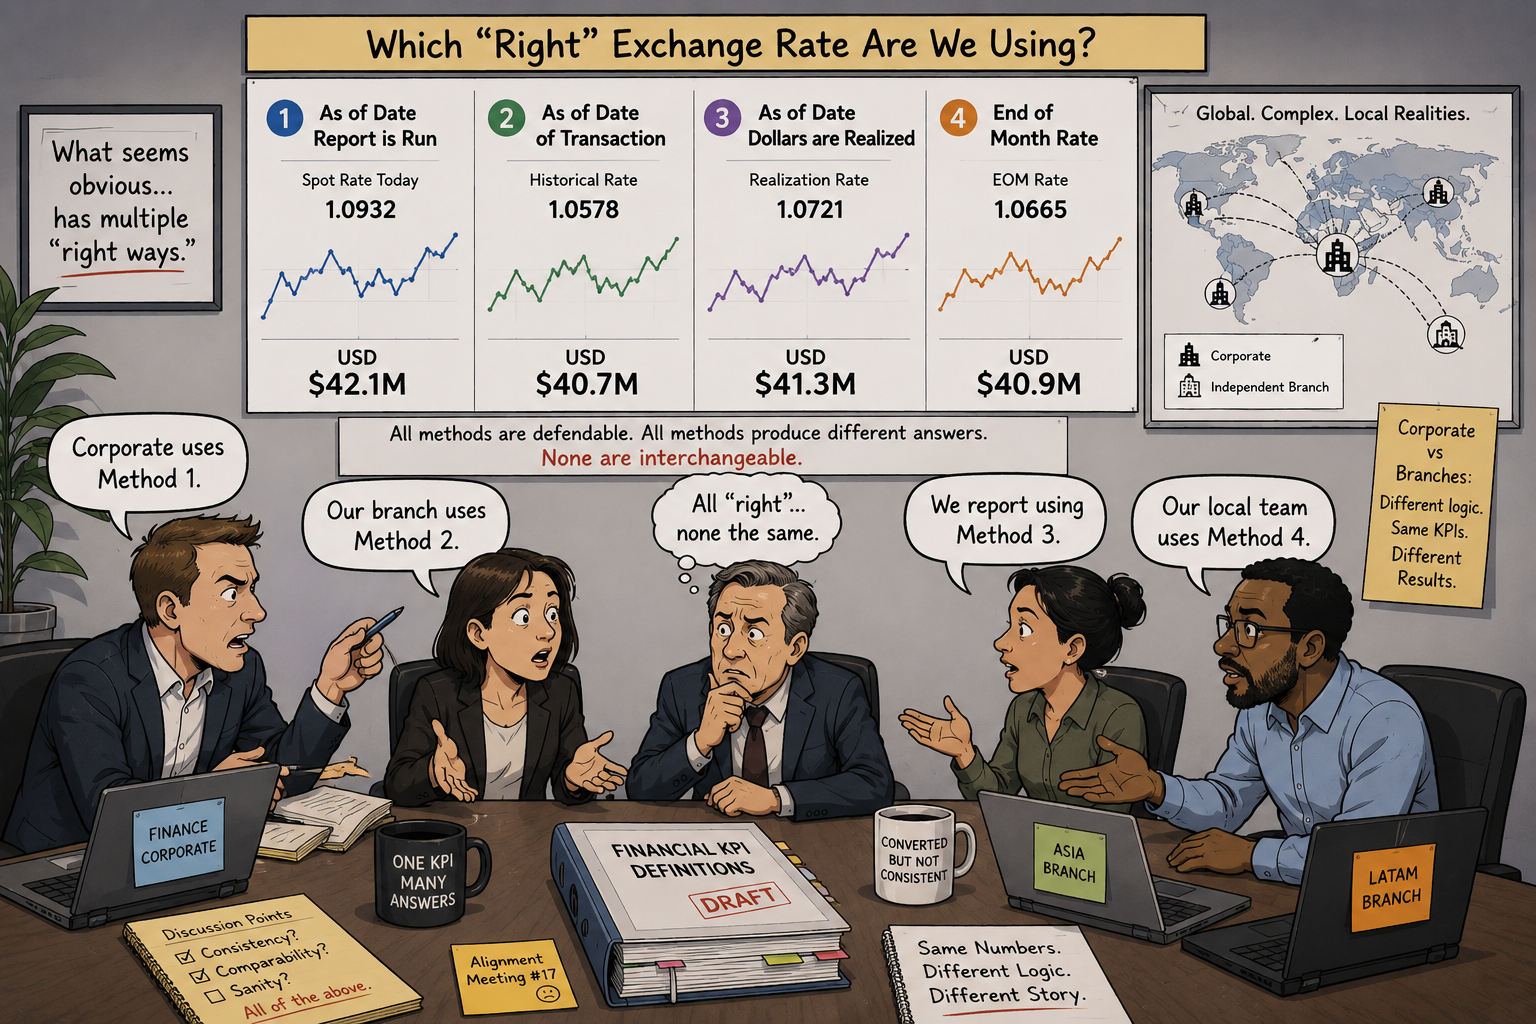
Except there are multiple “correct” ways to do it:
- exchange rate as of the transaction date,
- exchange rate at end-of-month,
- exchange rate when revenue is realized,
- exchange rate as of the reporting date.
Each approach has legitimate accounting and operational arguments behind it.
Corporate headquarters preferred one methodology. Independent regional branches preferred another. Every group believed its approach reflected business reality more accurately. Every report looked mathematically sound.
The numbers still failed to reconcile cleanly. Currency conversion derailed the discussion and ended up consuming most of the week. It affected every one of the financial KPIs.
This is where semantic drift becomes especially dangerous. The issue is rarely incompetence. More often, the organization contains multiple competing versions of business truth that evolved independently over time.
Power BI does not know which interpretation the business ultimately trusts.
It simply calculates what it is told.
Semantic Drift Behaves Like Technical Debt
Semantic inconsistency compounds quietly, much like financial debt.
Organizations borrow analytical clarity from the future every time they:
- duplicate measures,
- clone reports,
- override KPI definitions locally,
- or implement undocumented “temporary fixes.”
Initially, the debt feels manageable. Teams move faster. Stakeholders get their reports sooner. Business units gain flexibility.
Then the interest payments begin.
Analysts maintain private “known-good” spreadsheets. Finance reconciliation meetings multiply. Developers spend increasing amounts of time tracing inherited DAX logic, trying to determine which measure definition the organization actually considers authoritative.
| Is the definition of Profit:
CALCULATE(SUM(Revenue[Net Revenue]))-CALCULATE(SUM(Revenue[Net Cost])) Or, is it: CALCULATE(SUM(‘Global-Market’[Net Revenue]))-CALCULATE(SUM(‘Global-Market’[Net Cost])) |
|---|
Like government deficits, semantic debt grows slowly enough that organizations normalize it. Until eventually they cannot.
Greece discovered there are practical limits to financial debt. Enterprise analytics environments discover similar limits with semantic debt.
Sooner or later, somebody has to reconcile the meaning of the numbers.
Governance Usually Stops Too Early
Most Power BI governance conversations focus on infrastructure:
- permissions,
- workspaces,
- deployment pipelines,
- refresh schedules,
- tenant settings,
- certification labels.
All important. None directly addresses semantic consistency. The deeper governance challenge lives inside the business logic itself:
- duplicated measures,
- inherited assumptions,
- undocumented exceptions,
- conflicting KPI definitions,
- diverging DAX calculations,
- semantic lineage nobody fully understands anymore.
Organizations rarely lack dashboards. They lack shared meaning.
When Trust Starts Eroding
The effects usually appear gradually.
Executives begin asking why KPIs changed from the prior quarter, even though the business itself did not. Departments defend their own numbers rather than debating strategy. Users begin exporting data back into Excel. Finance teams maintain parallel reporting systems. The irony is painful. Self-service BI succeeded because it increased adoption. But unmanaged semantic drift eventually undermines the credibility that made the platform valuable in the first place.
The organization still has analytics. It simply no longer has agreement.
Exposing the Drift
This is the governance gap Soterre is designed to expose: by creating visibility into the semantic layer itself:
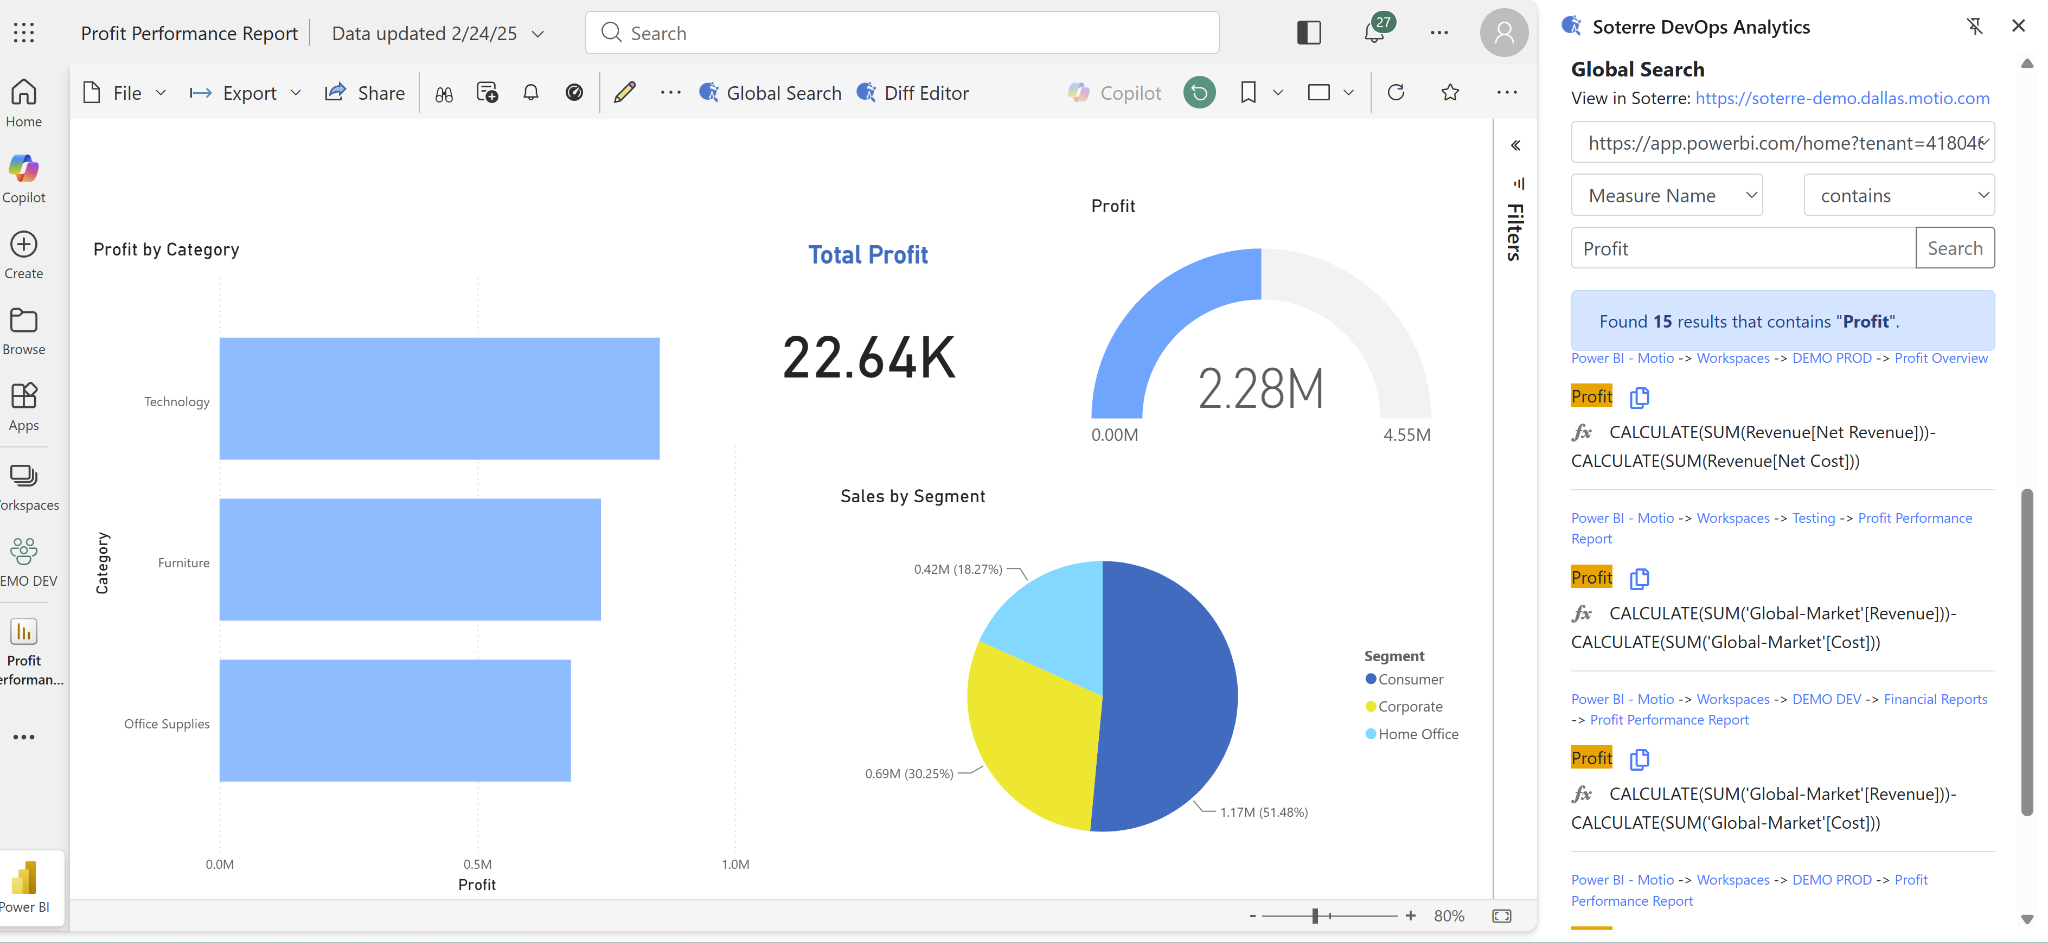
Multiple definitions of Profit were discovered by Soterre.
- comparing DAX logic,
- surfacing duplicated business rules,
- tracking metric evolution over time,
- identifying inconsistencies across reports and environments,
- and helping organizations understand when supposedly identical KPIs quietly stopped meaning the same thing.
Because the most dangerous analytics problems are rarely caused by broken dashboards. They emerge when everyone believes the dashboards are saying the same thing when they are not. In other words, you can’t take trust for granted. Soterre restores that trust.