Post: Cognos Monitoring – Get Alerts When Your Cognos Performance Starts To Hurt

Motio ReportCard is a fantastic tool for analyzing and optimizing your Cognos performance. ReportCard can assess the reports in your environment, locate issues that cause a decline in performance, and present the results of how much performance can be improved by fixing the identified issue. Another important feature of ReportCard is the ability to continuously monitor your environment. This feature is known as “System Monitoring” and will be the focus of this blog, as we teach you how to set up alerts when performance goes outside of your expectations.


Understanding System Monitoring

Click on the “System Monitoring” tab from the top menu.

Cognos System Monitoring

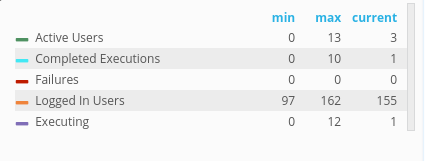
On the upper right hand corner, you will see the categories for “Current Cognos Activity.” These categories include active users, completed executions, failures, logged in users, and currently executing reports. The data for these categories are pulled from the Cognos audit database.

current Cognos activity Cognos audit database

On the bottom right corner, you will see “Server.” This will display your Memory, CPU Percentage and Disk Usage of your servers.


cognos system monitoring

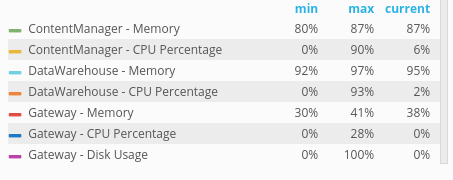
System Monitoring relies on “Current Cognos Activity” and “Server Metrics” to generate the appropriate alerts.


Setting Up System Monitoring

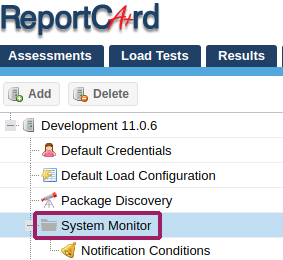
1. Click on “BI Environments” tab on the very top row.BI environments

2. Proceed to “System Monitor” on the left-hand dropdown menu. Here you can add any email accounts that will be alerted by System Monitoring.

ReportCard system monitoring

3. Next, click on “Notification Conditions” below

ReportCard notification conditions

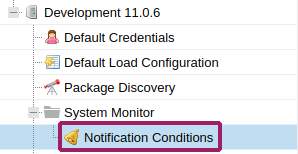
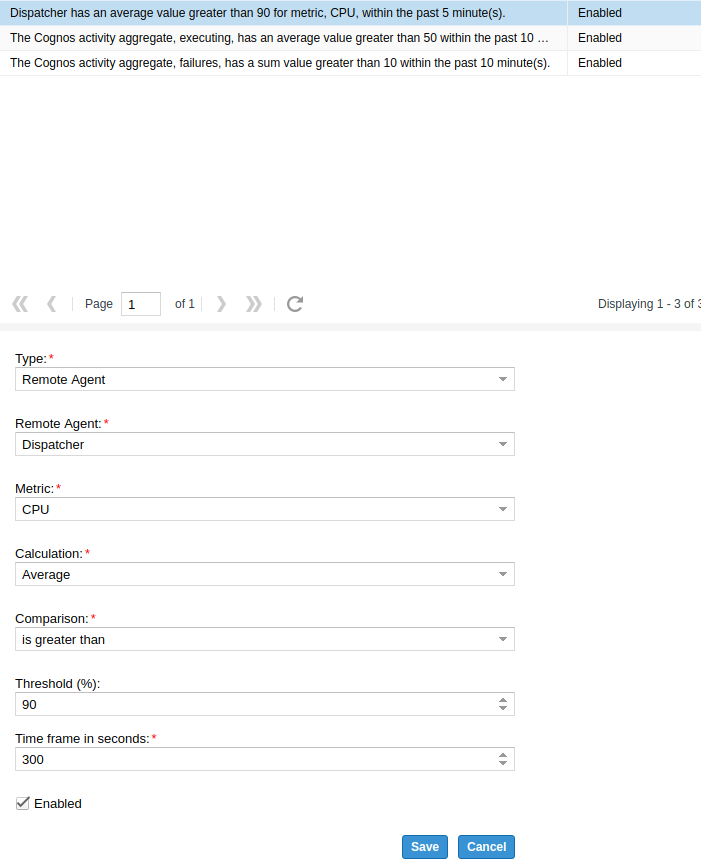
4. You can set up alerts that are tied to your “Current Cognos Activity” and “Server Metrics.” Click “Create” to begin setting up your alerts.

current cognos activity and server metrics

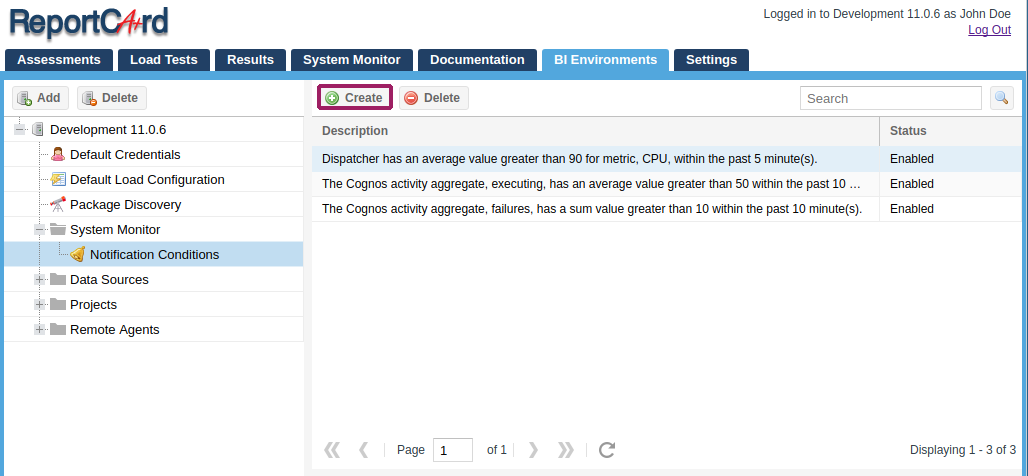
In this example, we have our notifications set up so that if our CPU usage spikes and averages over our 90% threshold in 5 minutes. We would be immediately alerted about this issue.

ReportCard notifications


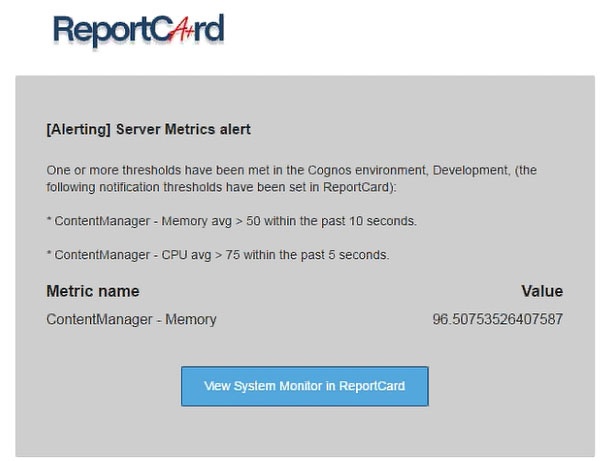
Server Metrics Alert

Here, we have an example of a “Server Metrics” alert email. This alert notifies us when the “Memory avg” is above 50 within the past 10 seconds, and if the “CPU avg” is above 75 within the past 5 seconds. We see that we were alerted because our “ContentManager – Memory” went above the specified “Memory avg” of 50. This alert is particularly useful to investigate why your Cognos Environment is slowing down.

ReportCard server metrics alert


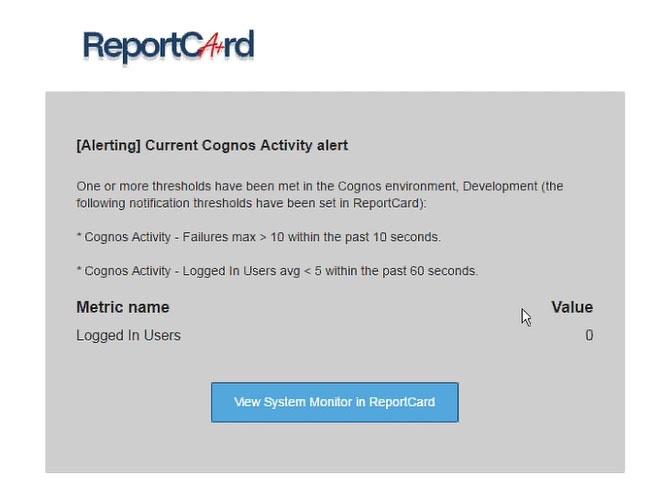
Current Cognos Activity Alert

Here, we have an example of an email alert about how many logged in users we have. This particular alert is notifying us that we have zero logged-in users within the past 60 seconds. This type of alert would be very useful to a Cognos Administrator who wants to conduct maintenance. So instead of waiting on usual off-peak hours, this alert would give valuable insight on when maintenance could be performed in your Cognos Environment.

current Cognos activity alert


Learn More About System Monitoring

There you have it! You have now set yourself up for a much easier position with identifying problems that may arise in your Cognos Environment! You can learn more about ReportCard on our website.

Scroll to Top
As the BI space evolves, organizations must take into account the bottom line of amassing analytics assets.
The more assets you have, the greater the cost to your business. There are the hard costs of keeping redundant assets, i.e., cloud or server capacity. Accumulating multiple versions of the same visualization not only takes up space, but BI vendors are moving to capacity pricing. Companies now pay more if you have more dashboards, apps, and reports. Earlier, we spoke about dependencies. Keeping redundant assets increases the number of dependencies and therefore the complexity. This comes with a price tag.
The implications of asset failures differ, and the business’s repercussions can be minimal or drastic.
Different industries have distinct regulatory requirements to meet. The impact may be minimal if a report for an end-of-year close has a mislabeled column that the sales or marketing department uses, On the other hand, if a healthcare or financial report does not meet the needs of a HIPPA or SOX compliance report, the company and its C-level suite may face severe penalties and reputational damage. Another example is a report that is shared externally. During an update of the report specs, the low-level security was incorrectly applied, which caused people to have access to personal information.
The complexity of assets influences their likelihood of encountering issues.
The last thing a business wants is for a report or app to fail at a crucial moment. If you know the report is complex and has a lot of dependencies, then the probability of failure caused by IT changes is high. That means a change request should be taken into account. Dependency graphs become important. If it is a straightforward sales report that tells notes by salesperson by account, any changes made do not have the same impact on the report, even if it fails. BI operations should treat these reports differently during change.
Not all reports and dashboards fail the same; some reports may lag, definitions might change, or data accuracy and relevance could wane. Understanding these variations aids in better risk anticipation.

Marketing uses several reports for its campaigns – standard analytic assets often delivered through marketing tools. Finance has very complex reports converted from Excel to BI tools while incorporating different consolidation rules. The marketing reports have a different failure mode than the financial reports. They, therefore, need to be managed differently.

It’s time for the company’s monthly business review. The marketing department proceeds to report on leads acquired per salesperson. Unfortunately, half the team has left the organization, and the data fails to load accurately. While this is an inconvenience for the marketing group, it isn’t detrimental to the business. However, a failure in financial reporting for a human resource consulting firm with 1000s contractors that contains critical and complex calculations about sickness, fees, hours, etc, has major implications and needs to be managed differently.

Acknowledging that assets transition through distinct phases allows for effective management decisions at each stage. As new visualizations are released, the information leads to broad use and adoption.
Think back to the start of the pandemic. COVID dashboards were quickly put together and released to the business, showing pertinent information: how the virus spreads, demographics affected the business and risks, etc. At the time, it was relevant and served its purpose. As we moved past the pandemic, COVID-specific information became obsolete, and reporting is integrated into regular HR reporting.
Reports and dashboards are crafted to deliver valuable insights for stakeholders. Over time, though, the worth of assets changes.
When a company opens its first store in a certain area, there are many elements it needs to understand – other stores in the area, traffic patterns, pricing of products, what products to sell, etc. Once the store is operational for some time, specifics are not as important, and it can adopt the standard reporting. The tailor-made analytic assets become irrelevant and no longer add value to the store manager.