Agile Workflow for Qlik Sense
Motio has been leading the adoption of Continuous Integration for agile development of Analytics and Business Intelligence for over 15 years.

Continuous Integration[1]is a methodology borrowed from the software development industry which incorporates new code as it is developed. Continuous Integration was one of twelve practices proposed by Kent Beck’s Extreme Programming in the 1990s for agile software development. Benefits of the process include reduced errors in integration and the more rapid development of a unified piece of software. The process doesn’t eliminate bugs, but it makes finding them infinitely easier because you know where to look – the latest code that was checked in and integrated. Plus, the earlier bugs are identified and fixed, the less cost. Defects which make it into production are much more costly to fix.
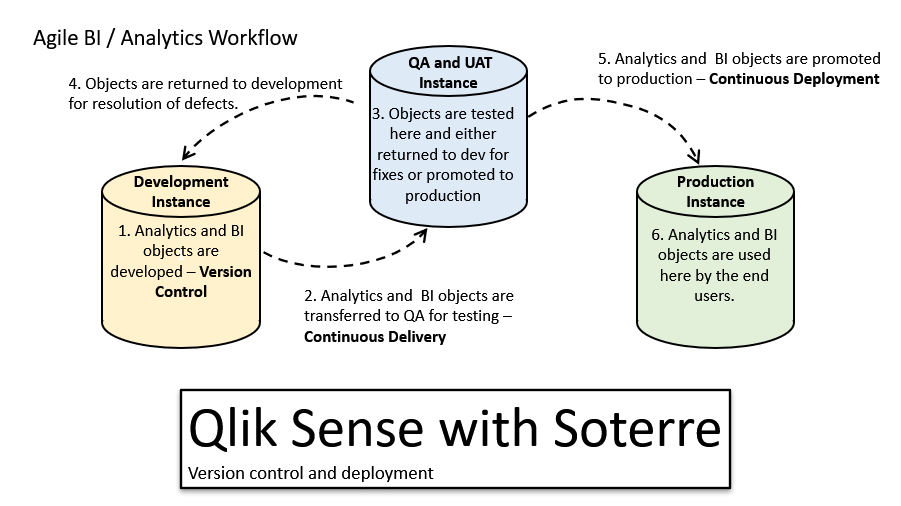
 Once you have Continuous Integration, you are one step closer to Continuous Deployment. For practical purposes, Continuous Delivery comes between Continuous Integration and Continuous Deployment. Continuous Delivery is the process of integrating software changes so that it can be tested as a whole. Continuous Deployment is the ability to get changes into production and into the hands of the users.
Martin Fowler remarks that, “The key test [of Continuous Delivery] is that a business sponsor could request that the current development version of the software can be deployed into production at a moment’s notice – and nobody would bat an eyelid, let alone panic.” So, Continuous Integration, Delivery, and Deployment is the sustainable ability to quickly and safely get changes in software code to the business users. That’s the gold standard for software development. Analytics and Business Intelligence development has adopted these processes for managing agile delivery of insights to stakeholders.
Motio has been leading the adoption of Continuous Integration in Analytics and Business Intelligence for over 15 years. Soterre was developed by Motio to fill the gaps in the already excellent tool, Qlik Sense. Soterre for Qlik Sense is a solution that enables version control and deployment management that is necessary for the Continuous Deployment and Continuous Delivery pieces of the agile BI lifecycle..
 The purpose of Continuous Delivery in Analytics and Business intelligence is the same as for software development – to support an agile development process by providing end users with real-time changes to reports, dashboards and analytics. We’ve seen that many of our clients have distinct Development, QA/UAT and Production environments to support their Analytics and BI development workflow. Soterre supports the Continuous Deployment workflow with a flexible deployment process. The tool allows you to connect multiple environments and safely promote targeted content between them. .
Soterre’s zero touch version control contributes to change management and audit support. Version control is the first step in Continuous Integration – managing collaboration from multiple authors. Soterre’s version control supports integration with GitLab (as well as GitHub, BitBucket, Azure DevOps, Gitea). GitLab is an open source collaborative project management software that owns two thirds of the Git self-managed market for source code maintenance.
In one case study, Qlik Sense with Soterre improved the production rate of Qlik apps, reduced duplicate and similar content, provided a safety net for developers needing to revert to a prior version and improved throughput of deployments, a key administrative task.
If your business is serious about analytics and business intelligence, you’re already trying to implement proven practices and industry standards. Those standards require an agile development framework. Agile requires Continuous Integration, Delivery and Deployment. The only way to do that with your analytics and Business Intelligence in Qlik Sense is to use Motio’s Soterre.
Interested in learning more about Soterre for Qlik Sense? Click HERE.


